

Editor: See the newest household income percentile calculator.
Below is a household income percentile calculator for the United States for 2018. Enter pre-tax household income earned between Jan. and Dec. 2017 to compare to household income percentiles in the full year. (Here is the individual income calculator).
Afterwards, visit the income percentile by state and income percentile by city calculator.
(See our math and methodology for household income brackets in the United States.)
Household Income Percentile Statistics in 2018
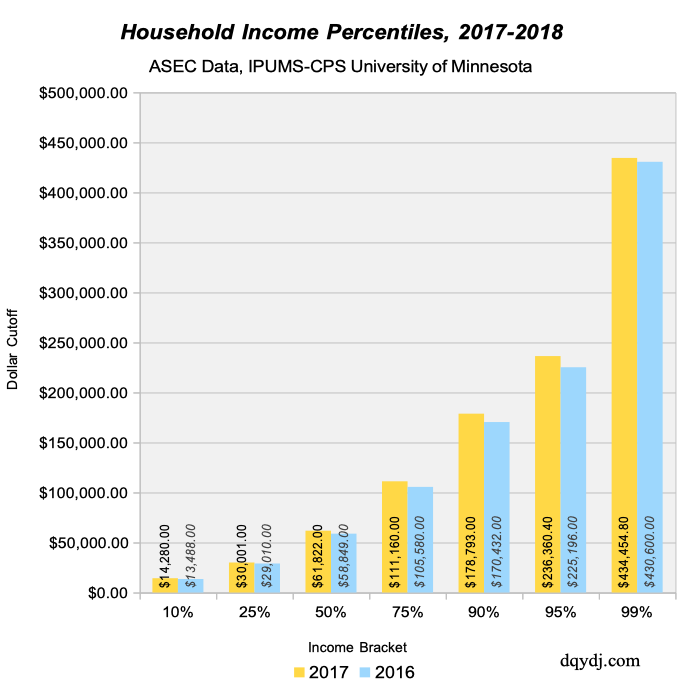
The following graph shows the changes in cutoffs for selected household income brackets between 2018 and 2017. The numbers shown are not adjusted for inflation.
What was the average household income?
In the United States, the average household income was $86,599.91 in 2018. This encompassed income earned between January and December 2017.
What was the median household income?
In the United States, the median household income was $61,822.00 in 2018. This encompassed income earned between January and December 2017. It is up from $58,849.00 in full-year 2016.
How many US households made $100,000 or more in 2018?
Roughly 29.5% of US Households, or 37,665,335 American Households made a six-figure income in 2018 (at least $100,000.00).
How many US households made $250,000 or More in 2018?
Around 4.3% of US Households, or 5,490,201 American Households made $250,000 or more in 2018.
What were the household income cutoffs for top 10% and top 5% in 2018?
The top 10% of US Households made $178,793.00 or more in 2018 while the top 5% of households made $236,360.40 or more.
What is the top one percent household income?
To reach the 1% in 2017, an American household would have to earn $434,454.80. Roughly 1,276,791 households made that or more for full year 2017.
To top .5% of American households made a total income of $599,071.50.
Although net worth is a better proxy for the 1% (see our one percent in America article), most often one-percenter refers to income.
(Because of topcoding it isn't appropriate to estimate a top .1% income using this data.)
What other calculators do you have?
Thanks for being a reader! Want more?
See our individual income by age calculator and individual income calculator. Also see our net worth calculator and net worth by age calculator.
Source and Methodology on the 2018 Household Income Percentile Calculator
Sarah Flood, Miriam King, Renae Rodgers, Steven Ruggles, and J. Robert Warren. Integrated Public Use Microdata Series, Current Population Survey: Version 6.0 [dataset]. Minneapolis, MN: IPUMS, 2018. https://doi.org/10.18128/D030.V6.0
See the household income bracket article for details. There are no adjustments of screens on the data, all numbers provided are for the complete set of households in the ASEC.
Also, see our previous year calculators to easily compare how household income has changed over time:
How did your household income compare to the US household income percentile distribution in 2018?
