
In this post, find the estimated United States household income brackets for 2021. See average, median, and top 1% household income in the United States.
The income in this post was earned between January and December 2020 (the survey is in March-April, 2021).
We also have research on individual incomes and incomes by age.
Household Income Benchmarks in 2021
The most important – or, at least, most closely watched – income statistics are:
- Median household income
- Average household income
- Top 1% household income
Median household income is the most important statistic. Medians are resistant to outliers, and better represent a "typical" household. Average income is influenced by very high earners, although it is also a decent estimate.
What was the median household income?
In 2021, $67,463 was the median household income in the United States. This is down from $68,400 in 2019.
What was the average household income?
The average household income was $96,955.04 in 2021. It was $97,973.61 in 2020 (not adjusted for inflation).
What is the top 1% household income?
To be in the top 1% in 2021, a household needed to earn $504,420.00. $531,020 was the threshold in 2020.
Selected United States Household Income Percentiles for 2021 and 2020
This section is adjusted for inflation – unlike the sections above.
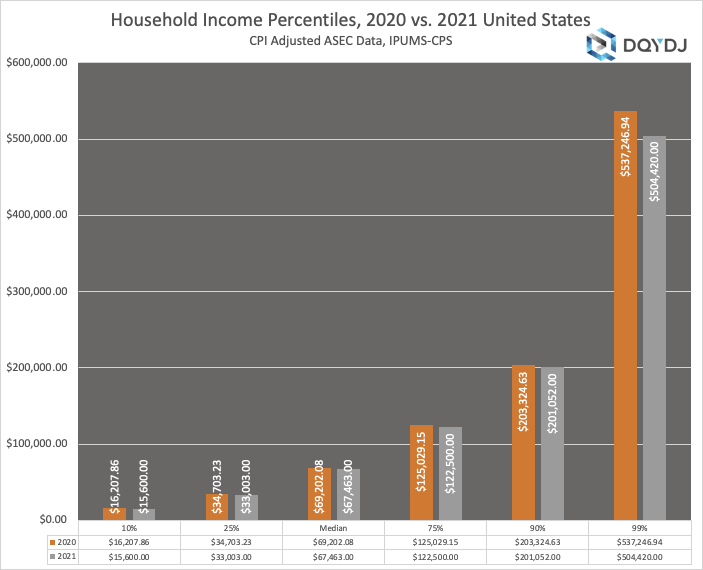
Due to the pandemic, household incomes were down in quite a few percentile brackets (which isn't really following on the net worth side). As you'll see in the next section, the threshold to be in the 89th through 97th percentile did increase.
Household income is defined as all income earned in the household:
- Wage income
- Business income
- Investment income
- Other income (find this list of all components)
Household Income Percentiles for the United States in 2021
While summary statistics are nice, there's no replacement for a more complete view of the US income distribution... so below, find every household income percentile in 2021.
| Household Income Percentile | 2021 | 2020 | Absolute Increase | Percentage Change |
| 1% | $0 | $0 | $0 | 0.00% |
| 2% | $800 | $1,400 | -$600 | -75.00% |
| 3% | $4,165 | $5,000 | -$835 | -20.05% |
| 4% | $7,200 | $8,174 | -$974 | -13.53% |
| 5% | $9,372 | $9,860 | -$488 | -5.21% |
| 6% | $10,735 | $11,130 | -$395 | -3.68% |
| 7% | $12,000 | $12,210 | -$210 | -1.75% |
| 8% | $13,200 | $13,596 | -$396 | -3.00% |
| 9% | $14,401 | $14,843 | -$442 | -3.07% |
| 10% | $15,600 | $16,020 | -$420 | -2.69% |
| 11% | $16,776 | $17,226 | -$450 | -2.68% |
| 12% | $18,000 | $18,427 | -$427 | -2.37% |
| 13% | $19,010 | $19,745 | -$735 | -3.87% |
| 14% | $20,000 | $20,826 | -$826 | -4.13% |
| 15% | $21,035 | $22,066 | -$1,031 | -4.90% |
| 16% | $22,300 | $23,502 | -$1,202 | -5.39% |
| 17% | $23,600 | $24,872 | -$1,272 | -5.39% |
| 18% | $24,800 | $25,668 | -$868 | -3.50% |
| 19% | $25,750 | $26,926 | -$1,176 | -4.57% |
| 20% | $27,012 | $28,035 | -$1,023 | -3.79% |
| 21% | $28,241 | $29,677 | -$1,436 | -5.08% |
| 22% | $29,700 | $30,480 | -$780 | -2.63% |
| 23% | $30,398 | $31,983 | -$1,585 | -5.21% |
| 24% | $31,800 | $33,005 | -$1,205 | -3.79% |
| 25% | $33,003 | $34,301 | -$1,298 | -3.93% |
| 26% | $34,510 | $35,289 | -$779 | -2.26% |
| 27% | $35,470 | $36,695 | -$1,225 | -3.45% |
| 28% | $36,712 | $38,200 | -$1,488 | -4.05% |
| 29% | $38,002 | $39,861 | -$1,859 | -4.89% |
| 30% | $39,506 | $40,348 | -$842 | -2.13% |
| 31% | $40,324 | $41,821 | -$1,497 | -3.71% |
| 32% | $41,781 | $43,000 | -$1,219 | -2.92% |
| 33% | $43,002 | $44,488 | -$1,486 | -3.46% |
| 34% | $44,517 | $45,300 | -$783 | -1.76% |
| 35% | $45,750 | $46,863 | -$1,113 | -2.43% |
| 36% | $47,120 | $48,200 | -$1,080 | -2.29% |
| 37% | $48,572 | $49,801 | -$1,229 | -2.53% |
| 38% | $50,000 | $50,310 | -$310 | -0.62% |
| 39% | $50,787 | $52,000 | -$1,213 | -2.39% |
| 40% | $52,145 | $53,431 | -$1,286 | -2.47% |
| 41% | $53,820 | $55,000 | -$1,180 | -2.19% |
| 42% | $55,010 | $56,100 | -$1,090 | -1.98% |
| 43% | $56,516 | $57,727 | -$1,211 | -2.14% |
| 44% | $58,014 | $59,274 | -$1,260 | -2.17% |
| 45% | $59,896 | $60,124 | -$228 | -0.38% |
| 46% | $60,701 | $61,851 | -$1,150 | -1.89% |
| 47% | $62,340 | $63,401 | -$1,061 | -1.70% |
| 48% | $64,182 | $65,001 | -$819 | -1.28% |
| 49% | $65,712 | $66,700 | -$988 | -1.50% |
| 50% | $67,463 | $68,400 | -$937 | -1.39% |
| 51% | $69,420 | $70,021 | -$601 | -0.87% |
| 52% | $70,738 | $71,885 | -$1,147 | -1.62% |
| 53% | $72,616 | $73,520 | -$904 | -1.24% |
| 54% | $74,315 | $75,044 | -$729 | -0.98% |
| 55% | $75,710 | $76,785 | -$1,075 | -1.42% |
| 56% | $77,504 | $79,001 | -$1,497 | -1.93% |
| 57% | $79,543 | $80,379 | -$836 | -1.05% |
| 58% | $81,010 | $82,403 | -$1,393 | -1.72% |
| 59% | $83,015 | $84,821 | -$1,806 | -2.18% |
| 60% | $85,051 | $86,402 | -$1,351 | -1.59% |
| 61% | $87,262 | $88,938 | -$1,676 | -1.92% |
| 62% | $89,868 | $90,718 | -$850 | -0.95% |
| 63% | $91,701 | $93,002 | -$1,301 | -1.42% |
| 64% | $93,901 | $95,204 | -$1,303 | -1.39% |
| 65% | $96,081 | $97,628 | -$1,547 | -1.61% |
| 66% | $98,557 | $100,000 | -$1,443 | -1.46% |
| 67% | $100,236 | $101,960 | -$1,724 | -1.72% |
| 68% | $102,625 | $104,416 | -$1,791 | -1.75% |
| 69% | $105,097 | $106,731 | -$1,634 | -1.55% |
| 70% | $107,964 | $109,560 | -$1,596 | -1.48% |
| 71% | $110,263 | $111,800 | -$1,537 | -1.39% |
| 72% | $113,052 | $115,000 | -$1,948 | -1.72% |
| 73% | $116,000 | $118,000 | -$2,000 | -1.72% |
| 74% | $119,834 | $120,508 | -$674 | -0.56% |
| 75% | $122,500 | $123,580 | -$1,080 | -0.88% |
| 76% | $125,823 | $126,626 | -$803 | -0.64% |
| 77% | $129,800 | $130,350 | -$550 | -0.42% |
| 78% | $133,202 | $134,212 | -$1,010 | -0.76% |
| 79% | $137,332 | $138,229 | -$897 | -0.65% |
| 80% | $141,100 | $142,400 | -$1,300 | -0.92% |
| 81% | $145,946 | $147,076 | -$1,130 | -0.77% |
| 82% | $150,275 | $151,212 | -$937 | -0.62% |
| 83% | $155,030 | $155,769 | -$739 | -0.48% |
| 84% | $160,010 | $160,522 | -$512 | -0.32% |
| 85% | $165,412 | $166,285 | -$873 | -0.53% |
| 86% | $171,277 | $172,104 | -$827 | -0.48% |
| 87% | $177,664 | $178,051 | -$387 | -0.22% |
| 88% | $184,696 | $185,005 | -$309 | -0.17% |
| 89% | $192,817 | $192,490 | $327 | 0.17% |
| 90% | $201,052 | $200,968 | $84 | 0.04% |
| 91% | $211,350 | $210,315 | $1,035 | 0.49% |
| 92% | $223,895 | $221,399 | $2,496 | 1.11% |
| 93% | $238,006 | $234,322 | $3,684 | 1.55% |
| 94% | $253,500 | $250,590 | $2,910 | 1.15% |
| 95% | $273,850 | $270,358 | $3,492 | 1.28% |
| 96% | $299,005 | $295,532 | $3,473 | 1.16% |
| 97% | $334,009 | $329,352 | $4,657 | 1.39% |
| 98% | $386,915 | $387,116 | -$201 | -0.05% |
| 99% | $504,420 | $531,020 | -$26,600 | -5.27% |
To read the chart: a dollar amount is the "threshold" between brackets – more income goes in the higher percentile, less in the lower. This data is adjusted for CPI-measured inflation.
What is considered a middle class income?
In 2021, middle class encompasses household income from $33,731.50 to $134,926.00. This measure of middle class uses the range from half of median household income to twice the median household income.
Of course, a lot boils down to your location. Check out these geographic income calculators:
Methodology on 2021 United States Household Income Brackets
Data originated in the United States Census Bureau's Annual ASEC survey, first released in September 2021. The University of Minnesota's Minnesota Population Center harmonizes it, making it easy to do these calculations – see the household income by year post, for an example.
Sarah Flood, Miriam King, Renae Rodgers, Steven Ruggles, J. Robert Warren and Michael Westberry. Integrated Public Use Microdata Series, Current Population Survey: Version 9.0 [dataset]. Minneapolis, MN: IPUMS, 2021. https://doi.org/10.18128/D030.V9.0
How many samples are in the 2021 and 2020 data?
- 2021: 62,850 data points representing roughly 130,023,134 households.
- 2020: 60,460 data points representing around 128,588,200 households.
In this post, is household income gross or net?
The household income data in this post is before-tax, or gross income.
Analysis of Household Income in 2021
This is always a fun post to start (along with all of the counterpart income posts – start here on the Income category page.)
I'm the first to admit it can be challenging to approach, though. If you'd prefer something interactive, I also build a household income percentile calculator. Hope you enjoyed the post – and the tool!
Past editions:
