
On this page I estimate United States Household Income Brackets for 2019. I calculate the average, median, and top 1% household income in the United States. I also compute and show you every household income centile and a year-over-year comparison with 2018.
To repeat: this is household income data. 2019 income is income earned between January and December 2018.
We also have research on individual incomes and incomes by age.
Household Income Benchmarks in 2019
First up, I computed:
- Median household income
- Average household income
- Top 1% household income
The median household income is the most important summary statistic. Medians are more resistant to outliers and better represent a "typical" household.
Median means the midpoint of household income: half of US households made more and half less.
What was the median household income?
Median household income was $63,030.00 in 2019.
What was the average household income?
Average household income in 2019 in the United States was $89,930.70.
What is the top 1% household income?
The threshold for a US household to be in the top 1% in 2019 was $475,116.00.
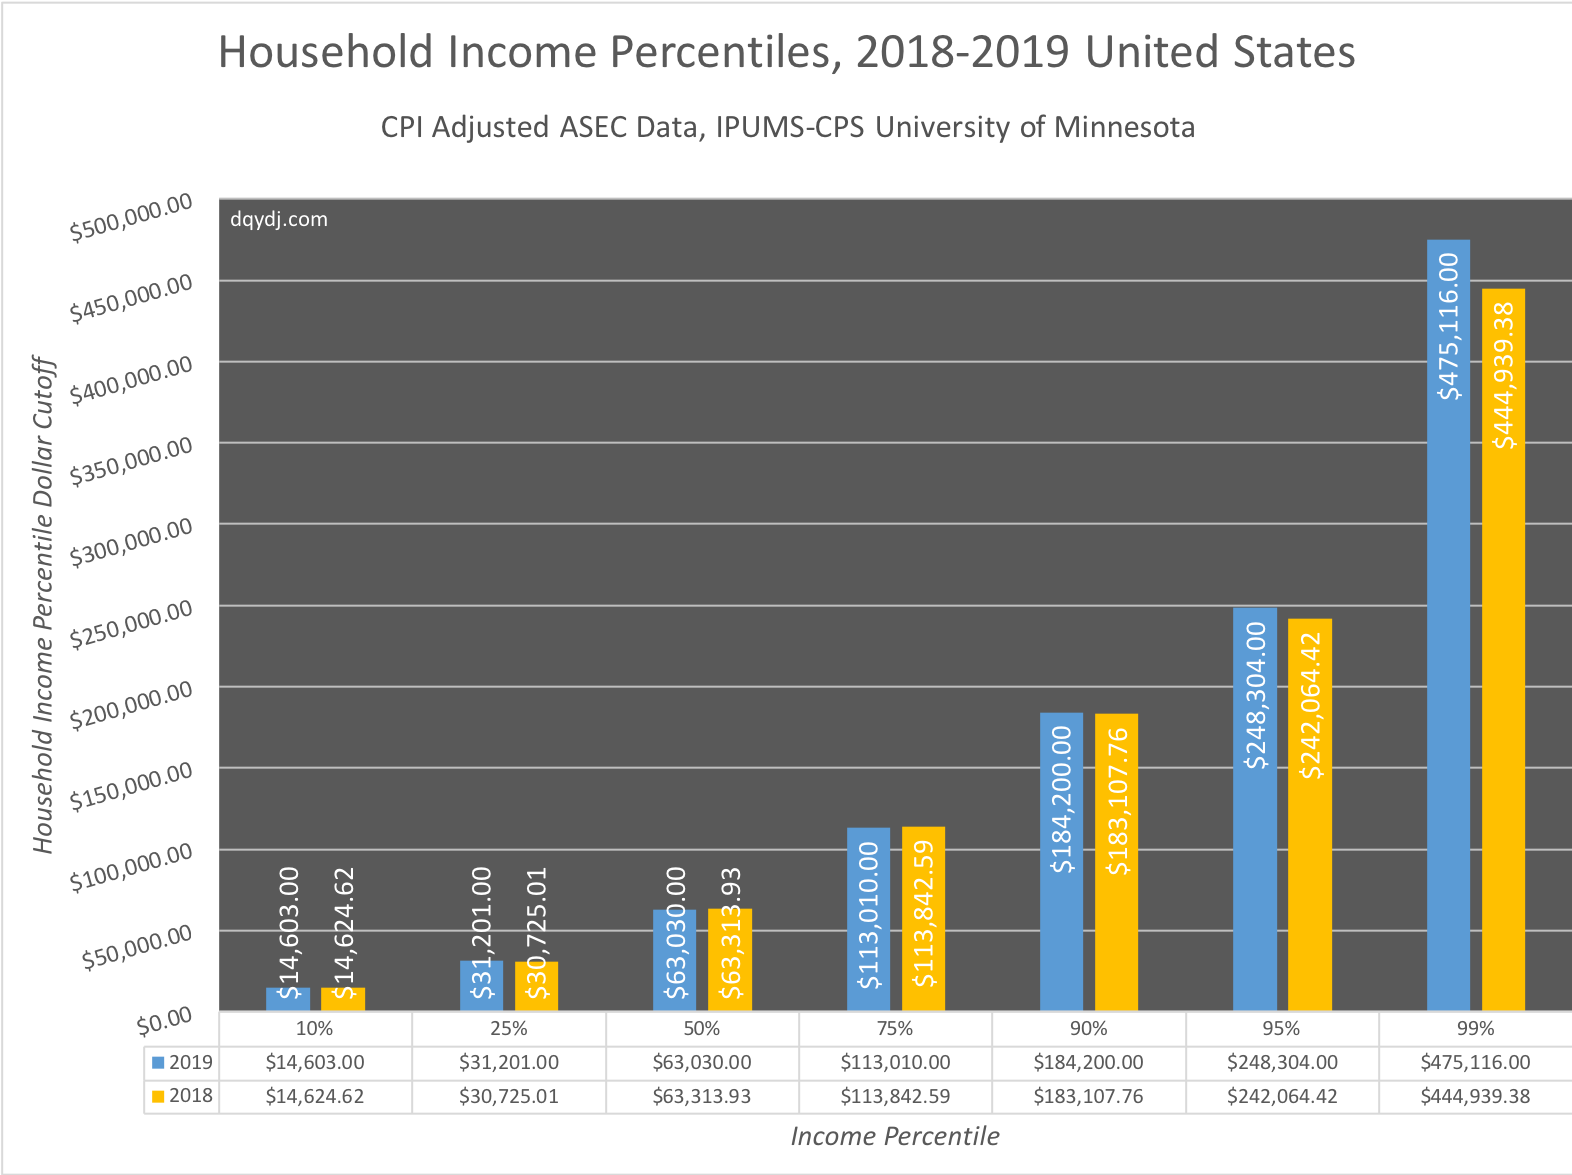
Selected United States Household Income Percentiles for 2019 and 2019
The most interesting comparison we do in our income series annually is our year over year comparison. Here we take the 10th, 25th, 50th/median, 75th, 90th, 95th, and 99th percentile of household incomes in the United States to see the changes in percentile thresholds.
The 2019 data is adjusted for CPI as detailed by IPUMS CPS. To do the math on your own, multiply 2018 dollar amounts by (.679/.663).
Household income is defined as all income earned in the household:
- Wage income
- Business income
- Investment income
- Other income: see the list of all components
As I've said in past years: this incomes encompasses all the ways households make income, from stocks & bonds to wages. Like a tax return's income entry, it's not just wages from jobs.
In past years your objections about IRS and Social Security administration income data have been enthralling... but apples and oranges, friends. Read the above income component link and note how comprehensive this data is before rehashing objections which have been discussed here annually since 2011.
Comprehensive Household Income Bracket Comparison 2018 vs. 2019
In the 2018 data, nearly every household income percentile threshold saw an increase. That wasn't the case in 2019, but we did see a slight majority of household income thresholds tick up:
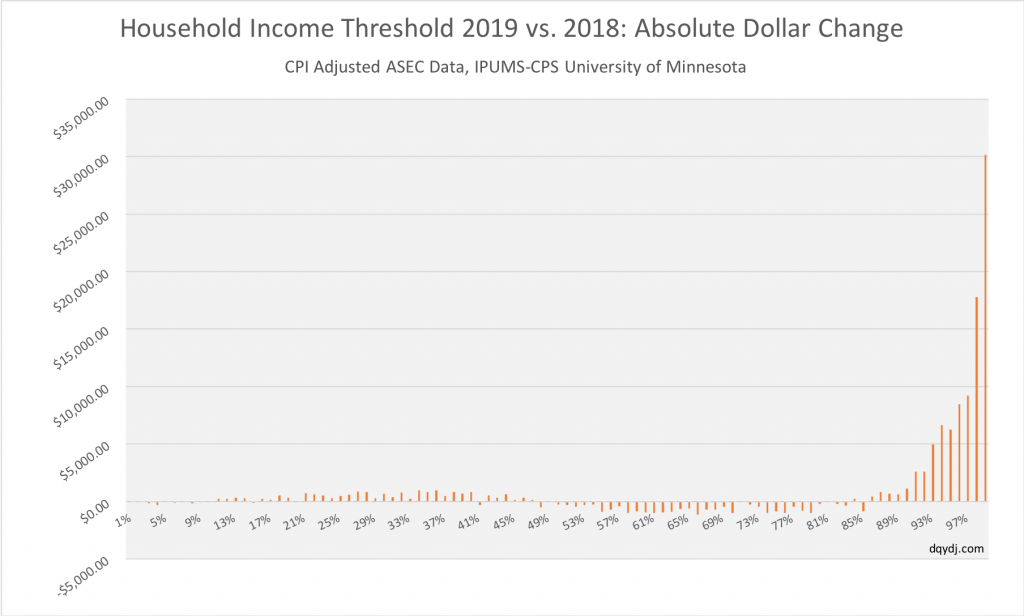
Very interestingly, the top 14% of thresholds (household income 86%+, or starting at $156,441.00) saw an increase. Before you speculate on what that means see the note on how data isn't longitudinal.
But – it is interesting to observe. Let's talk more in the conclusion.
Household Income Percentiles for the United States in 2019
To summarize, median household income in the United States was $63,030.00 and the threshold for a top 1% household was a whopping $475,116.00. Adjusted for inflation (CPI), the breakpoints were down 0.45% and up 6.78% vs. 2018, respectively.
Average household income in the United States was $89,930.70, up 1.40% adjusted for inflation.
| Household Income Percentile | 2019 | 2018 | Percentage Increase | Absolute Increase |
| 1% | $0.00 | $0.00 | 0.00% | $0.00 |
| 2% | $600.00 | $632.34 | -5.11% | -$32.34 |
| 3% | $4,000.00 | $4,147.74 | -3.56% | -$147.74 |
| 4% | $7,000.00 | $7,300.67 | -4.12% | -$300.67 |
| 5% | $9,000.00 | $9,032.85 | -0.36% | -$32.85 |
| 6% | $10,000.00 | $10,138.91 | -1.37% | -$138.91 |
| 7% | $11,000.00 | $11,060.63 | -0.55% | -$60.63 |
| 8% | $12,104.00 | $12,289.59 | -1.51% | -$185.59 |
| 9% | $13,367.00 | $13,383.08 | -0.12% | -$16.08 |
| 10% | $14,603.00 | $14,624.62 | -0.15% | -$21.62 |
| 11% | $15,648.00 | $15,413.07 | 1.52% | $234.93 |
| 12% | $16,859.00 | $16,620.53 | 1.43% | $238.47 |
| 13% | $18,000.00 | $17,662.19 | 1.91% | $337.81 |
| 14% | $19,021.00 | $18,765.31 | 1.36% | $255.69 |
| 15% | $20,000.00 | $20,092.46 | -0.46% | -$92.46 |
| 16% | $21,032.00 | $20,819.88 | 1.02% | $212.12 |
| 17% | $22,211.00 | $22,059.82 | 0.69% | $151.18 |
| 18% | $23,623.00 | $23,104.43 | 2.24% | $518.57 |
| 19% | $24,779.00 | $24,462.15 | 1.30% | $316.85 |
| 20% | $25,555.00 | $25,514.63 | 0.16% | $40.37 |
| 21% | $26,840.00 | $26,126.32 | 2.73% | $713.68 |
| 22% | $28,000.00 | $27,380.48 | 2.26% | $619.52 |
| 23% | $29,218.00 | $28,675.72 | 1.89% | $542.28 |
| 24% | $30,004.00 | $29,712.14 | 0.98% | $291.86 |
| 25% | $31,201.00 | $30,725.01 | 1.55% | $475.99 |
| 26% | $32,300.00 | $31,748.11 | 1.74% | $551.89 |
| 27% | $33,669.00 | $32,796.99 | 2.66% | $872.01 |
| 28% | $35,000.00 | $34,168.39 | 2.43% | $831.61 |
| 29% | $35,906.00 | $35,651.08 | 0.72% | $254.92 |
| 30% | $37,000.00 | $36,351.18 | 1.78% | $648.82 |
| 31% | $38,060.00 | $37,688.08 | 0.99% | $371.92 |
| 32% | $39,712.00 | $38,917.04 | 2.04% | $794.96 |
| 33% | $40,381.00 | $40,148.99 | 0.58% | $232.01 |
| 34% | $41,957.00 | $40,975.55 | 2.40% | $981.45 |
| 35% | $43,040.00 | $42,235.23 | 1.91% | $804.77 |
| 36% | $44,599.00 | $43,619.08 | 2.25% | $979.92 |
| 37% | $45,552.00 | $45,082.32 | 1.04% | $469.68 |
| 38% | $47,000.00 | $46,188.39 | 1.76% | $811.61 |
| 39% | $48,300.00 | $47,647.90 | 1.37% | $652.10 |
| 40% | $50,000.00 | $49,160.42 | 1.71% | $839.58 |
| 41% | $50,272.00 | $50,594.21 | -0.64% | -$322.21 |
| 42% | $51,801.00 | $51,265.38 | 1.04% | $535.62 |
| 43% | $53,058.00 | $52,746.69 | 0.59% | $311.31 |
| 44% | $54,890.00 | $54,255.03 | 1.17% | $634.97 |
| 45% | $56,000.00 | $55,849.64 | 0.27% | $150.36 |
| 46% | $57,435.00 | $57,111.46 | 0.57% | $323.54 |
| 47% | $59,000.00 | $58,858.96 | 0.24% | $141.04 |
| 48% | $60,015.00 | $60,526.24 | -0.84% | -$511.24 |
| 49% | $61,520.00 | $61,505.23 | 0.02% | $14.77 |
| 50% | $63,030.00 | $63,313.93 | -0.45% | -$283.93 |
| 51% | $64,859.00 | $65,153.36 | -0.45% | -$294.36 |
| 52% | $66,110.00 | $66,585.01 | -0.71% | -$475.01 |
| 53% | $67,894.00 | $68,223.09 | -0.48% | -$329.09 |
| 54% | $69,563.00 | $69,825.94 | -0.38% | -$262.94 |
| 55% | $70,798.00 | $71,691.34 | -1.25% | -$893.34 |
| 56% | $72,521.00 | $73,226.51 | -0.96% | -$705.51 |
| 57% | $74,640.00 | $75,064.87 | -0.57% | -$424.87 |
| 58% | $75,830.00 | $76,822.24 | -1.29% | -$992.24 |
| 59% | $77,566.00 | $78,442.63 | -1.12% | -$876.63 |
| 60% | $79,526.00 | $80,463.24 | -1.16% | -$937.24 |
| 61% | $81,000.00 | $81,981.58 | -1.20% | -$981.58 |
| 62% | $83,020.00 | $83,978.88 | -1.14% | -$958.88 |
| 63% | $85,040.00 | $85,967.91 | -1.08% | -$927.91 |
| 64% | $87,004.00 | $87,672.15 | -0.76% | -$668.15 |
| 65% | $89,452.00 | $90,063.26 | -0.68% | -$611.26 |
| 66% | $91,001.00 | $92,171.95 | -1.27% | -$1,170.95 |
| 67% | $93,268.00 | $93,954.67 | -0.73% | -$686.67 |
| 68% | $95,572.00 | $96,293.51 | -0.75% | -$721.51 |
| 69% | $98,150.00 | $98,609.15 | -0.47% | -$459.15 |
| 70% | $100,201.00 | $101,208.07 | -1.00% | -$1,007.07 |
| 71% | $102,671.00 | $102,745.79 | -0.07% | -$74.79 |
| 72% | $105,100.00 | $105,377.89 | -0.26% | -$277.89 |
| 73% | $107,592.00 | $108,051.66 | -0.43% | -$459.66 |
| 74% | $110,200.00 | $111,220.81 | -0.92% | -$1,020.81 |
| 75% | $113,010.00 | $113,842.59 | -0.73% | -$832.59 |
| 76% | $116,115.00 | $117,135.34 | -0.87% | -$1,020.34 |
| 77% | $119,686.00 | $120,151.25 | -0.39% | -$465.25 |
| 78% | $122,300.00 | $123,108.13 | -0.66% | -$808.13 |
| 79% | $126,000.00 | $127,022.49 | -0.80% | -$1,022.49 |
| 80% | $130,000.00 | $130,212.74 | -0.16% | -$212.74 |
| 81% | $133,602.00 | $133,691.72 | -0.07% | -$89.72 |
| 82% | $138,000.00 | $138,204.01 | -0.15% | -$204.01 |
| 83% | $142,141.00 | $142,496.72 | -0.25% | -$355.72 |
| 84% | $147,100.00 | $146,879.52 | 0.15% | $220.48 |
| 85% | $151,124.00 | $151,993.59 | -0.57% | -$869.59 |
| 86% | $156,441.00 | $156,017.40 | 0.27% | $423.60 |
| 87% | $162,503.00 | $161,681.35 | 0.51% | $821.65 |
| 88% | $169,000.00 | $168,306.38 | 0.41% | $693.62 |
| 89% | $175,847.00 | $175,210.23 | 0.36% | $636.77 |
| 90% | $184,200.00 | $183,107.76 | 0.60% | $1,092.24 |
| 91% | $194,041.00 | $191,460.71 | 1.35% | $2,580.29 |
| 92% | $203,606.00 | $201,022.26 | 1.29% | $2,583.74 |
| 93% | $216,170.00 | $211,185.84 | 2.36% | $4,984.16 |
| 94% | $231,175.00 | $224,513.74 | 2.97% | $6,661.26 |
| 95% | $248,304.00 | $242,064.42 | 2.58% | $6,239.58 |
| 96% | $272,000.00 | $263,534.71 | 3.21% | $8,465.29 |
| 97% | $305,501.00 | $296,284.84 | 3.11% | $9,216.16 |
| 98% | $359,173.00 | $341,405.05 | 5.20% | $17,767.95 |
| 99% | $475,116.00 | $444,939.38 | 6.78% | $30,176.62 |
51 of the 99 quoted percentiles saw an increase. That means roughly 52% of household income bracket thresholds increased between 2018 and 2019.
What is considered middle class income?
In 2019, middle class encompasses household income from $31,515 to $126,060. This definition of middle class is half of median household income to 2x median household income.
Of course, this is location dependent. We have higher resolution data you should look at for expensive locales:
Methodology on 2019 United States Household Income Brackets
Data originated in the United States Census Bureau's Annual ASEC survey, first released in September 2019. The University of Minnesota's Minnesota Population Center harmonizes it and makes it easy for us to create extracts to bring into R. Their take on the data was released first in October, 2019.
Sarah Flood, Miriam King, Renae Rodgers, Steven Ruggles and J. Robert Warren. Integrated Public Use Microdata Series, Current Population Survey: Version 6.0 [dataset]. Minneapolis, MN: IPUMS, 2019. https://doi.org/10.18128/D030.V6.0
How can I cite your household income data?
You can quote an excerpt and link back to this page, citing "Don't Quit Your Day Job...". Also include the IPUMS citation right before this section.
How many samples are in the 2019 and 2018 data?
- 2019: 68,345 data-points representing an estimated 128,674,487 American households.
- 2018: 67,909 data-points representing an estimated 127,679,100 American households.
Is household income gross or net?
The household income data in this post is gross income, that is before tax income. I make no adjustments to the 2019 data for anything like taxes or cost of living.
The 2018 data is adjusted for inflation to fairly compare it to the cost of living one year later.
Can you compare this household income data year over year?
Yes, you can compare household income data but you need to be very careful with your comparisons.
This data is not longitudinal.
You can not draw any conclusions about the performance of individual households from this data. Households in certain income brackets move up or down the income spectrum, but the data as presented doesn't give any history or hint of movement.
The only fair way to draw conclusions about the performance of last year's households is with repeat surveys given to the same subjects.
With all of those caveats in mind, try the household income by year calculator.
Analysis of Household Income in 2019
To start, if you'd rather see the data in interactive form we built a household income percentile calculator. In this initial analysis of the 2019 United States household income data, a few things stuck out.
Household Income Round Number Thresholds
First, we are rapidly approaching two round number thresholds in 2019:
- Average household income is nearing $90,000
- Top 1% household income is nearing $500,000
$500,000 is an interesting breakpoint. It's not interesting because "the math doesn't scratch", but rather that "half a million dollars" feels like an important threshold.
Ignoring inflation, the top 1% threshold increased 9.4% year over year. If we print a similar increase next year you could be looking at an income of $520,000 to crack the top 1% of households in 2020.
Household Income Bracket Thresholds Increasing
Also interesting were the household income brackets that increased dollar thresholds:
- The 86th percentile to the 99th percentile increased
- The 16th percentile to the 40th percentile increased
Now, you can't draw conclusions because the data isn't longitudinal. (Think: households can be forming or merging, people can be immigrating and emigrating, families can time buying and selling decisions, etc.).
But – it was interesting to see the middle percentiles struggling while the lower-middles and upper percentile thresholds soar. Longitudinal data aside, it suggests some interesting paths for research.
