
Here you'll find estimated United States household income brackets for 2026. See average, median, and top 1% household income in the United States.
The income in this post was earned between January and December 2025 (the survey took place in March-April, 2026).
We also have research on individual incomes and incomes by age.
Household income benchmarks in 2026
The most important – or, at least, most closely watched – income statistics are:
- Median household income
- Average household income
- Top 1% household income
Median household income is the most important statistic. Medians are resistant to outliers, and better represent a "typical" household. Average income is influenced by very high earners, although it is also a decent estimate.
These next three sections are unadjusted for inflation. See the chart below for the adjustment.
What was the median household income?
In 2026, $87,288 was the median household income in the United States. This is up from $83,592 in 2025 (for inflation adjustment see below, or in the individual year links at the bottom).
What was the average household income?
The average household income was $126,664.22 in 2026. It was $120,952.12 in 2025... not adjusted for inflation.
What is the top 1% household income?
To be a top 1% income in 2026, a household needed $704,999. $659,060 was the (non-inflation-adjusted) threshold in 2025.
Selected United States household income percentiles for 2026 and 2025
This section is adjusted for inflation (using the Census Bureau's method) – unlike the sections above.
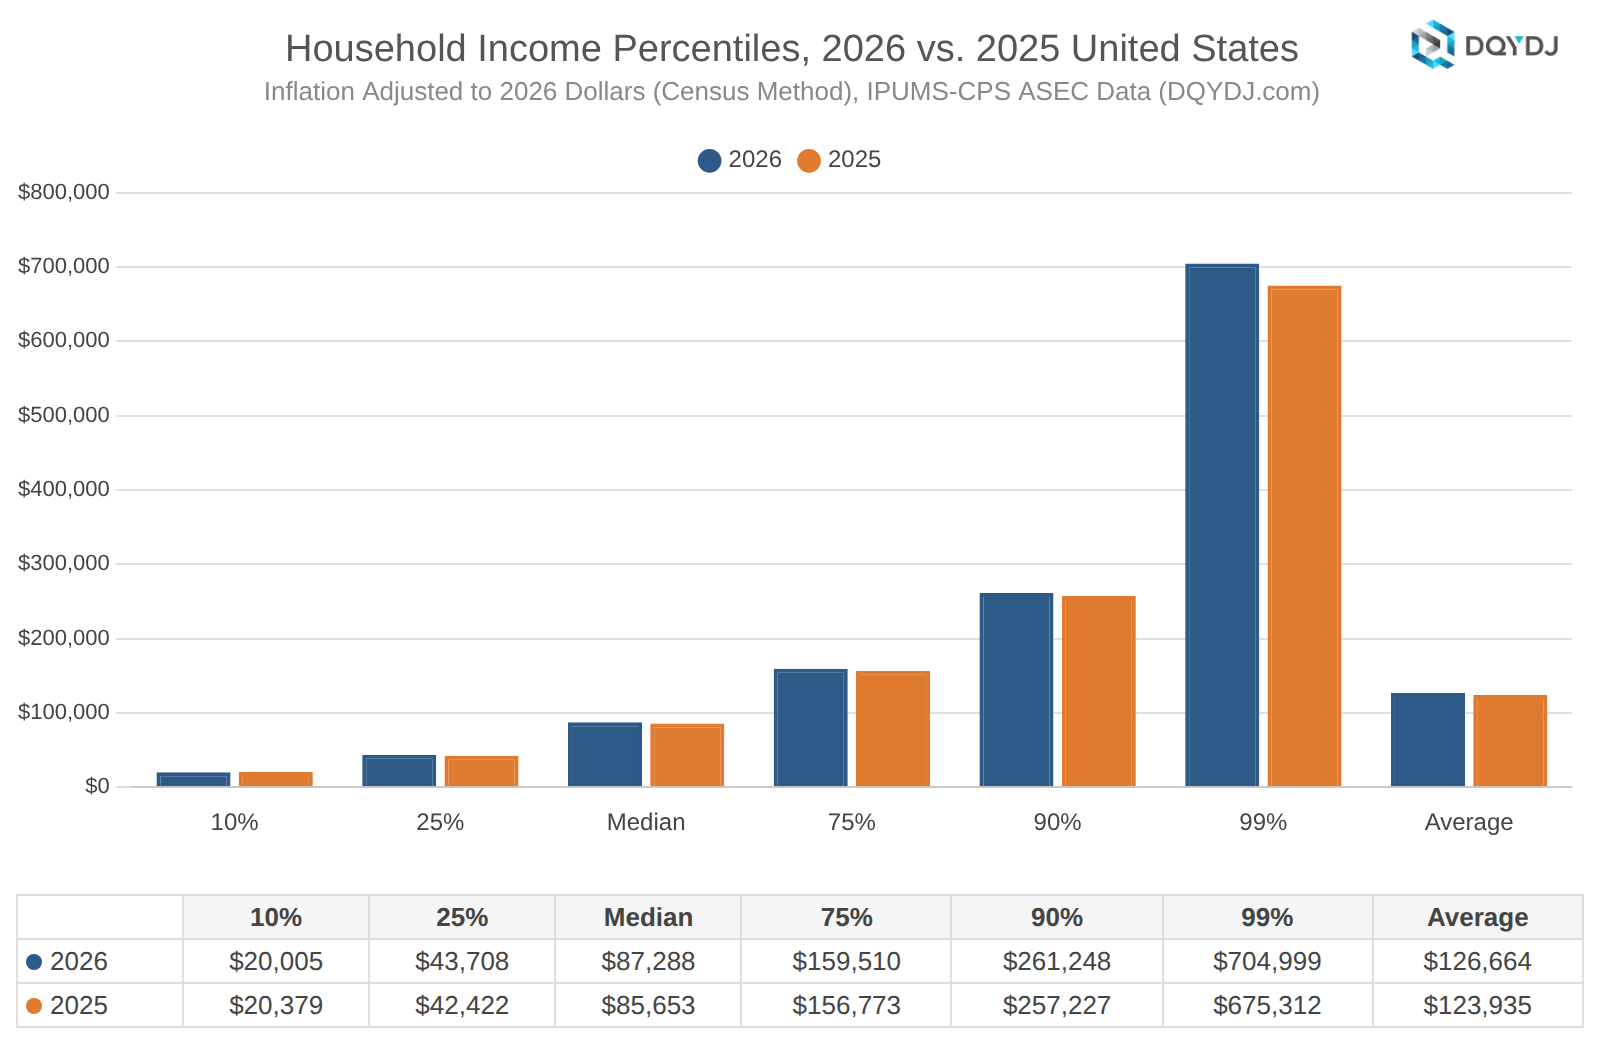
Across percentiles, it was a good year for household income percentiles. Adjusted for inflation, only 3 income percentile 'brackets' declined, year over year – more on that in a second.
And, to anticipate your questions, household income is defined as all income earned in the household:
- Wage income
- Business income
- Investment income (interest, dividends, and rent – but not capital gains)
- Other income (find this list of all components)
Household income percentiles for the United States in 2026
Sick of the summaries? I've got you here! Here's a higher resolution look at the data: below, find every household income percentile in 2026.
This data is not inflation adjusted. Inflation was 2.47% year over year, using the Census Bureau's method. That means a percentage change of under +2.47% in a percentile would mean lower purchasing power. Nominally, only the 2nd and 3rd percentiles declined (by $7 and $36). The 10th percentile declined once you adjust for inflation.
(Let me stress: the data is not longitudinal – it is not necessarily the same households in the same brackets between years).
| Percentile | 2026 | 2025 | Change ($) | Change (%) |
| 1% | $0 | $0 | $0 | 0.00% |
| 2% | $1,463 | $1,470 | -$7 | -0.48% |
| 3% | $5,365 | $5,401 | -$36 | -0.67% |
| 4% | $10,000 | $9,600 | $400 | 4.17% |
| 5% | $11,953 | $11,604 | $349 | 3.01% |
| 6% | $13,620 | $13,200 | $420 | 3.18% |
| 7% | $15,000 | $14,628 | $372 | 2.54% |
| 8% | $16,752 | $16,272 | $480 | 2.95% |
| 9% | $18,528 | $18,000 | $528 | 2.93% |
| 10% | $20,005 | $19,889 | $116 | 0.58% |
| 11% | $21,696 | $21,000 | $696 | 3.31% |
| 12% | $23,500 | $22,501 | $999 | 4.44% |
| 13% | $25,000 | $24,016 | $984 | 4.10% |
| 14% | $26,225 | $25,297 | $928 | 3.67% |
| 15% | $28,000 | $26,836 | $1,164 | 4.34% |
| 16% | $29,821 | $28,464 | $1,357 | 4.77% |
| 17% | $30,904 | $30,000 | $904 | 3.01% |
| 18% | $32,500 | $31,081 | $1,419 | 4.57% |
| 19% | $34,526 | $32,600 | $1,926 | 5.91% |
| 20% | $35,740 | $34,476 | $1,264 | 3.67% |
| 21% | $37,348 | $35,501 | $1,847 | 5.20% |
| 22% | $39,010 | $37,001 | $2,009 | 5.43% |
| 23% | $40,126 | $38,695 | $1,431 | 3.70% |
| 24% | $42,000 | $40,000 | $2,000 | 5.00% |
| 25% | $43,708 | $41,401 | $2,307 | 5.57% |
| 26% | $45,011 | $43,182 | $1,829 | 4.24% |
| 27% | $46,848 | $45,000 | $1,848 | 4.11% |
| 28% | $48,629 | $46,246 | $2,383 | 5.15% |
| 29% | $50,000 | $48,000 | $2,000 | 4.17% |
| 30% | $51,306 | $49,448 | $1,858 | 3.76% |
| 31% | $52,959 | $50,272 | $2,687 | 5.34% |
| 32% | $54,802 | $52,000 | $2,802 | 5.39% |
| 33% | $56,100 | $53,708 | $2,392 | 4.45% |
| 34% | $58,030 | $55,127 | $2,903 | 5.27% |
| 35% | $60,000 | $57,000 | $3,000 | 5.26% |
| 36% | $61,000 | $58,867 | $2,133 | 3.62% |
| 37% | $62,900 | $60,005 | $2,895 | 4.82% |
| 38% | $65,000 | $61,458 | $3,542 | 5.76% |
| 39% | $66,515 | $63,429 | $3,086 | 4.87% |
| 40% | $68,553 | $65,056 | $3,497 | 5.38% |
| 41% | $70,150 | $67,073 | $3,077 | 4.59% |
| 42% | $72,100 | $69,300 | $2,800 | 4.04% |
| 43% | $74,200 | $70,625 | $3,575 | 5.06% |
| 44% | $75,620 | $72,323 | $3,297 | 4.56% |
| 45% | $77,725 | $74,340 | $3,385 | 4.55% |
| 46% | $80,000 | $75,801 | $4,199 | 5.54% |
| 47% | $81,090 | $77,900 | $3,190 | 4.09% |
| 48% | $83,093 | $80,000 | $3,093 | 3.87% |
| 49% | $85,052 | $81,244 | $3,808 | 4.69% |
| 50% | $87,288 | $83,592 | $3,696 | 4.42% |
| 51% | $90,000 | $85,380 | $4,620 | 5.41% |
| 52% | $91,915 | $87,601 | $4,314 | 4.92% |
| 53% | $94,005 | $90,000 | $4,005 | 4.45% |
| 54% | $96,270 | $92,000 | $4,270 | 4.64% |
| 55% | $99,016 | $94,432 | $4,584 | 4.85% |
| 56% | $100,505 | $96,596 | $3,909 | 4.05% |
| 57% | $103,000 | $99,100 | $3,900 | 3.94% |
| 58% | $105,135 | $100,701 | $4,434 | 4.40% |
| 59% | $108,000 | $103,050 | $4,950 | 4.80% |
| 60% | $110,220 | $105,411 | $4,809 | 4.56% |
| 61% | $112,888 | $108,044 | $4,844 | 4.48% |
| 62% | $115,551 | $110,692 | $4,859 | 4.39% |
| 63% | $118,922 | $113,784 | $5,138 | 4.52% |
| 64% | $121,277 | $116,520 | $4,757 | 4.08% |
| 65% | $124,800 | $120,000 | $4,800 | 4.00% |
| 66% | $127,401 | $122,016 | $5,385 | 4.41% |
| 67% | $130,320 | $125,177 | $5,143 | 4.11% |
| 68% | $134,058 | $128,520 | $5,538 | 4.31% |
| 69% | $137,655 | $131,160 | $6,495 | 4.95% |
| 70% | $140,901 | $135,020 | $5,881 | 4.36% |
| 71% | $144,401 | $138,776 | $5,625 | 4.05% |
| 72% | $148,006 | $142,110 | $5,896 | 4.15% |
| 73% | $151,220 | $146,005 | $5,215 | 3.57% |
| 74% | $155,000 | $150,000 | $5,000 | 3.33% |
| 75% | $159,510 | $153,000 | $6,510 | 4.25% |
| 76% | $163,246 | $156,605 | $6,641 | 4.24% |
| 77% | $168,043 | $161,064 | $6,979 | 4.33% |
| 78% | $172,702 | $165,530 | $7,172 | 4.33% |
| 79% | $177,576 | $170,412 | $7,164 | 4.20% |
| 80% | $182,372 | $175,696 | $6,676 | 3.80% |
| 81% | $188,277 | $181,002 | $7,275 | 4.02% |
| 82% | $194,991 | $186,936 | $8,055 | 4.31% |
| 83% | $200,500 | $193,040 | $7,460 | 3.86% |
| 84% | $206,610 | $199,654 | $6,956 | 3.48% |
| 85% | $213,404 | $206,000 | $7,404 | 3.59% |
| 86% | $220,645 | $213,082 | $7,563 | 3.55% |
| 87% | $229,400 | $220,858 | $8,542 | 3.87% |
| 88% | $239,122 | $230,250 | $8,872 | 3.85% |
| 89% | $249,665 | $240,060 | $9,605 | 4.00% |
| 90% | $261,248 | $251,036 | $10,212 | 4.07% |
| 91% | $273,642 | $263,177 | $10,465 | 3.98% |
| 92% | $287,631 | $277,971 | $9,660 | 3.48% |
| 93% | $305,710 | $294,910 | $10,800 | 3.66% |
| 94% | $325,500 | $312,261 | $13,239 | 4.24% |
| 95% | $354,000 | $335,575 | $18,425 | 5.49% |
| 96% | $386,400 | $366,980 | $19,420 | 5.29% |
| 97% | $438,701 | $408,400 | $30,301 | 7.42% |
| 98% | $522,500 | $484,613 | $37,887 | 7.82% |
| 99% | $704,999 | $659,060 | $45,939 | 6.97% |
To read the chart: a dollar amount is the "threshold" between brackets. More income than a number? Higher bracket, and vice versa for lower.
What is considered a middle class income?
In 2026, middle class encompasses household income from $43,644 to $174,576. This measure of middle class uses the range from half of median household income to twice the median household income.
Of course, a lot boils down to your location. Make sure you visit these geographic income calculators:
Methodology on 2026 United States household income brackets
Data originated in the United States Census Bureau's Annual ASEC survey, first released in September 2026. The University of Minnesota's Minnesota Population Center harmonizes it, making it easy to do these calculations – see the household income by year post, for an example. For my setup, I use RStudio (and a lot of Excel, the world's most popular programming language).
Sarah Flood, Miriam King, Renae Rodgers, Steven Ruggles, J. Robert Warren, Daniel Backman, Etienne Breton, Grace Cooper, Julia A. Rivera Drew, Stephanie Richards, David Van Riper, and Kari C.W. Williams. IPUMS CPS: Version 13.0 [dataset]. Minneapolis, MN: IPUMS, 2025. https://doi.org/10.18128/D030.V13.0
How many samples are in the 2026 and 2025 data?
- 2026: 53,344 data points representing around 137,123,797 households.
- 2025: 55,762 data points representing around 134,963,893 households.
In this post, is household income gross or net?
The household income data in this post is before-tax, or gross income.
Analysis of household income in 2026
You know I enjoy updating these annual income posts (and you know you enjoy reading them!). You can browse others here on the Income category page. Alternatively, see our household income by year or household income percentile growth tools.
Some of you prefer something interactive, though. I also build a household income percentile calculator – check it out!
Past editions:
