
DQYDJ is – at times – a personal finance web site. One of the ways I keep it personal is by sharing my asset allocation annually.
While you may not particularly care for my family's money management and personal financial moves, with the topics DQYDJ covers, I need to be transparent. By sharing our broad portfolio allocation, you can see how we're approaching the markets and anticipating risks – and you can use that information to judge my other work.
Or if you prefer: all that, more eloquently stated by Nassim Taleb:
Don't tell me what you think, tell me what you have in your portfolio.
– Nassim Taleb, Skin in the Game
Indeed. And conveniently, I just filed our 2019 taxes – so I now have this information handy. So let's talk about my family's current liquid asset allocation.
(Find the 2019 version of the post here.)
Risk and Safety in June 2020
It's been a tough year. Between losing my grandmother to COVID and losing our dog to cancer in February, we're – with you! – ready for 2021.
On the finance side? Overall, my feeling when looking at our portfolio is dissonance.
In my opinion, the market hasn't been taking COVID-19 seriously enough (Fed moves included). That means that just like last year, even though we're in our mid-30s (with two kids), we'd prefer to be on the safer side of the allocation fence – probably closer to 60/40 risky:safe investable assets.
My definition of safe is investment-grade corporates, treasuries, municipal bonds, cash, and the like. Risky is everything else – commodities to crypto to stock to real estate to whatever other things you're imagining.
Here's how our investable assets stack up:
- Risky: 71.0%
- Safe: 29.0%
Despite my intentions, we're still missing our target. Some of this is due to my employer's – Twilio – stock price runup this year (which is great!), but I'll be looking to de-risk some in the coming weeks.
Domestic and International Split in June 2020
Last year during this exercise, I told you we were heavily weighted towards domestic investments (and felt strange) but wasn't actively looking to move funds. This year we've got even more of a home country bias:
- Cash & Bonds (Domestic): 28.8%
- International Stock & Risky: 5.8%
- Domestic Stock & Risky: 65.4%
Yes, this still feels weird. I might actively make some moves to get more of our portfolio into non-US securities. However, maybe it doesn't matter so much – I'll paste below the same arguments from last year:
- We plan to retire here (Forex risks are baked in)
- Large public companies already do business overseas (JL Collins has best led the charge on this argument)
- We know the US best
Just like last year, the third one is the weakest argument. Knowing a country best can also introduce blind spots and bias. Still – while I might move some funds overseas, I'm not overly concerned with the current allocation.
Asset Allocation by Style in June 2020
As I did last year, I also split up our allocation by type of investment based on these four buckets:
- Large Cap Stocks & RE: 12.1%
- Medium and Small Cap Stocks (including vested equity): 59.1%
- Short Term Debt, Cash, CDs, and the like (under 24 months duration): 23.9%
- Intermediate and Long Term Debt (anything longer): 4.9%
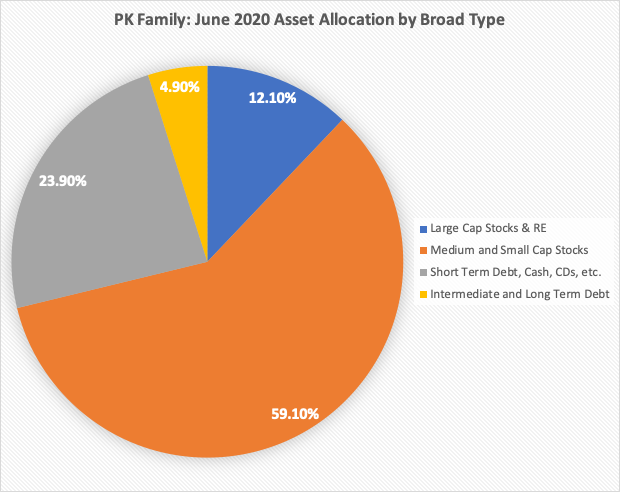
Well, there's the issue, haha. That smaller cap bucket has grown over last year's results – it includes my employer stock and several concentrated bets on other (mostly SaaS) tech companies that have run up quite a bit.
It looks like I have some pruning to do in the coming months. I'll be turning some of those smaller cap investments into large caps or safer options.
Savings Rate in 2019
As per tradition, I also calculated our savings rate in 2019. (Here's the 2018 post). Our net after-tax savings rate in 2019 was 64.4%. Including principal pay downs of various sorts, it was 66.8%.
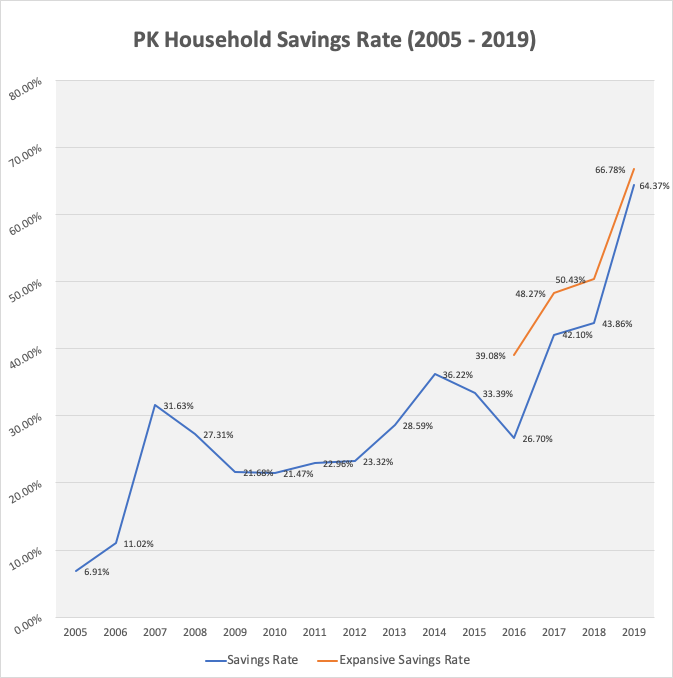
We're happy with that number plus finally pushing it up past 50% towards another magic savings rate breakpoint.
That said – I'm going to stop reporting our savings rate on the site after this year. Our websites are making more money, and it feels disingenuous to print a savings rate considering those income streams. It's just becoming inauthentic and doesn't align with those original 2005 numbers (before this site even existed!).
Of course, we'll continue to track the rate for ourselves. But – the days of presenting it in an article are over.
How is Your Current Asset Allocation?
It's an unprecedented, stressful year – but this work is worth doing. Only by knowing where you stand can you chart a course.
I'm writing this on Sunday night, June 28, so the market might turn volatile again... but trying to look at your allocation when things are calm (or, at least, you feel calm about markets) is the ideal time.
Oh, and only do this once a quarter at most, and ideally once a year if you can put it off. It's not worth micromanaging your allocation. Get your portfolio set up to best handle whatever markets are next. Balance the risk of a drop with your FOMO – Fear of Missing Out – during a rise.
I hope you're doing okay. 2020 sucks – but we're all in this together. Stay safe and healthy, and keep in mind that 2021 is going to be incredible.
