
n this page is an individual income percentile by age calculator for the United States. Enter age and pre-tax (gross) income earned in full-year 2020 to compare to income distribution by age. Optionally plot income distribution for other ages using the pull-down menu.
(Find the math and methodology in the median, top 1%, and average income by age research post.)
What else is there? See our individual income calculator and household income calculator.
What was the average and median income by age in 2021?
In this chart I've listed the median and average income by age, plus the top 1% by age. For completeness, it also includes the 25%, 75%, and 90% income by age breakpoints.
| Age | 25% | Median | 75% | 90% | 99% | Average |
| 16 | $0.00 | $1,729.00 | $5,040.00 | $15,000.00 | $79,255.00 | $5,821.30 |
| 17 | $480.00 | $3,000.00 | $8,000.00 | $16,000.00 | $66,000.00 | $6,760.37 |
| 18 | $1,437.00 | $5,053.00 | $12,600.00 | $24,200.00 | $55,105.00 | $9,725.23 |
| 19 | $3,999.00 | $10,569.00 | $21,008.00 | $30,110.00 | $80,000.00 | $15,062.78 |
| 20 | $6,000.00 | $14,087.00 | $25,000.00 | $35,001.00 | $100,013.00 | $18,513.14 |
| 21 | $8,000.00 | $17,000.00 | $30,000.00 | $41,850.00 | $83,061.00 | $20,712.18 |
| 22 | $10,000.00 | $20,001.00 | $33,002.00 | $50,180.00 | $100,310.00 | $24,447.43 |
| 23 | $12,000.00 | $24,000.00 | $38,400.00 | $58,000.00 | $120,000.00 | $29,814.28 |
| 24 | $15,000.00 | $28,400.00 | $44,850.00 | $61,210.00 | $150,000.00 | $33,164.56 |
| 25 | $20,000.00 | $34,371.00 | $52,000.00 | $78,090.00 | $180,210.00 | $41,461.27 |
| 26 | $20,804.00 | $35,000.00 | $56,333.00 | $83,452.00 | $176,010.00 | $43,945.65 |
| 27 | $23,660.00 | $40,000.00 | $60,104.00 | $88,000.00 | $202,002.00 | $48,376.91 |
| 28 | $25,000.00 | $39,005.00 | $60,001.00 | $85,500.00 | $191,422.00 | $47,399.65 |
| 29 | $24,615.00 | $41,085.00 | $64,264.00 | $100,061.00 | $205,002.00 | $51,638.49 |
| 30 | $25,000.00 | $40,560.00 | $66,010.00 | $100,101.00 | $230,410.00 | $52,706.53 |
| 31 | $28,000.00 | $45,000.00 | $70,105.00 | $105,503.00 | $301,120.00 | $59,068.01 |
| 32 | $26,001.00 | $45,330.00 | $70,410.00 | $108,010.00 | $291,919.00 | $58,708.88 |
| 33 | $28,000.00 | $49,033.00 | $75,000.00 | $109,602.00 | $270,000.00 | $59,082.00 |
| 34 | $28,000.00 | $48,200.00 | $72,010.00 | $120,000.00 | $271,219.00 | $60,506.92 |
| 35 | $28,404.00 | $50,001.00 | $79,103.00 | $130,000.00 | $393,001.00 | $66,320.38 |
| 36 | $28,299.00 | $50,879.00 | $83,100.00 | $135,161.00 | $351,825.00 | $68,082.22 |
| 37 | $30,000.00 | $50,022.00 | $84,022.00 | $132,695.00 | $376,390.00 | $69,128.48 |
| 38 | $28,300.00 | $50,000.00 | $82,900.00 | $135,000.00 | $354,040.00 | $66,746.23 |
| 39 | $29,000.00 | $50,000.00 | $85,007.00 | $132,002.00 | $397,000.00 | $70,235.80 |
| 40 | $30,052.00 | $53,210.00 | $90,010.00 | $147,750.00 | $362,820.00 | $72,731.18 |
| 41 | $30,000.00 | $52,400.00 | $92,136.00 | $150,336.00 | $462,350.00 | $77,143.30 |
| 42 | $30,000.00 | $50,501.00 | $85,011.00 | $140,000.00 | $435,124.00 | $71,286.43 |
| 43 | $30,000.00 | $53,000.00 | $93,001.00 | $152,000.00 | $810,001.00 | $83,279.50 |
| 44 | $30,000.00 | $52,005.00 | $86,075.00 | $150,611.00 | $376,768.00 | $74,478.19 |
| 45 | $30,000.00 | $54,001.00 | $93,821.00 | $148,833.00 | $532,022.00 | $79,101.10 |
| 46 | $30,000.00 | $54,000.00 | $94,050.00 | $150,800.00 | $401,749.00 | $75,233.96 |
| 47 | $30,070.00 | $55,002.00 | $94,552.00 | $155,065.00 | $445,400.00 | $78,354.08 |
| 48 | $27,000.00 | $50,000.00 | $83,009.00 | $150,000.00 | $315,003.00 | $68,728.45 |
| 49 | $30,000.00 | $52,001.00 | $90,750.00 | $151,951.00 | $375,060.00 | $75,458.16 |
| 50 | $31,000.00 | $56,001.00 | $97,648.00 | $161,687.00 | $500,101.00 | $81,711.22 |
| 51 | $30,000.00 | $54,012.00 | $92,201.00 | $150,201.00 | $435,830.00 | $75,777.31 |
| 52 | $30,015.00 | $55,432.00 | $92,504.00 | $152,100.00 | $400,990.00 | $80,279.55 |
| 53 | $30,000.00 | $55,100.00 | $100,020.00 | $160,001.00 | $414,005.00 | $80,802.58 |
| 54 | $30,033.00 | $55,010.00 | $92,580.00 | $155,000.00 | $402,695.00 | $77,406.45 |
| 55 | $29,500.00 | $52,000.00 | $93,000.00 | $151,200.00 | $500,160.00 | $77,308.78 |
| 56 | $30,020.00 | $55,940.00 | $99,558.00 | $153,055.00 | $403,576.00 | $76,857.49 |
| 57 | $32,020.00 | $55,002.00 | $92,500.00 | $161,362.00 | $450,024.00 | $78,139.14 |
| 58 | $30,001.00 | $54,007.00 | $90,003.00 | $150,653.00 | $360,252.00 | $73,165.04 |
| 59 | $30,000.00 | $54,005.00 | $93,730.00 | $151,180.00 | $456,414.00 | $78,624.85 |
| 60 | $30,000.00 | $51,861.00 | $91,590.00 | $150,400.00 | $379,440.00 | $73,392.66 |
| 61 | $30,084.00 | $52,001.00 | $89,050.00 | $159,000.00 | $458,513.00 | $77,592.46 |
| 62 | $29,180.00 | $52,006.00 | $92,676.00 | $160,001.00 | $402,180.00 | $77,624.55 |
| 63 | $30,329.00 | $52,300.00 | $90,000.00 | $154,788.00 | $423,180.00 | $77,189.64 |
| 64 | $30,011.00 | $51,051.00 | $82,200.00 | $153,018.00 | $367,395.00 | $73,604.15 |
| 65 | $30,000.00 | $54,299.00 | $89,831.00 | $150,000.00 | $279,005.00 | $74,420.36 |
| 66 | $32,125.00 | $53,385.00 | $91,336.00 | $162,005.00 | $448,000.00 | $79,289.75 |
| 67 | $37,002.00 | $67,189.00 | $102,064.00 | $166,025.00 | $600,007.00 | $93,445.14 |
| 68 | $31,190.00 | $55,051.00 | $101,000.00 | $160,000.00 | $435,870.00 | $84,150.09 |
| 69 | $33,126.00 | $58,002.00 | $100,000.00 | $154,110.00 | $543,216.00 | $82,464.49 |
| 70 | $32,093.00 | $54,904.00 | $86,005.00 | $137,018.00 | $365,965.00 | $76,164.60 |
| 71 | $32,045.00 | $51,335.00 | $93,076.00 | $144,085.00 | $430,035.00 | $76,744.71 |
| 72 | $35,022.00 | $59,289.00 | $105,701.00 | $178,803.00 | $829,265.00 | $98,444.27 |
| 73 | $31,260.00 | $52,480.00 | $102,641.00 | $175,840.00 | $866,002.00 | $92,254.10 |
| 74 | $31,260.00 | $52,761.00 | $84,100.00 | $136,195.00 | $359,000.00 | $70,337.44 |
| 75 | $32,031.00 | $49,235.00 | $81,847.00 | $148,287.00 | $313,798.00 | $70,820.15 |
As we tell you annually – the data is noisy. You can read the source post for some explanation, but know that we can't be perfect with these income breaks. You're getting a "feel" for the threshold, not the exact percentage – take a look a year or two up and down for comparison purposes.
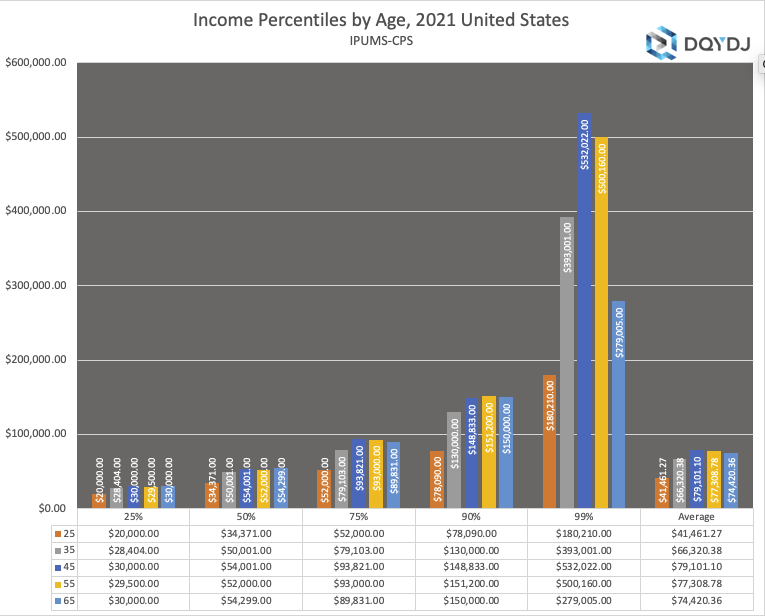
Average, Median and Selected Income Percentiles for Ages 25-65
This next graph shows selected income percentiles for certain ages: 25, 35, 45, 55, and 65. 65 has a hitch at the top 1% – likely due to the pandemic combined with sampling issues.
Source and Methodology on the 2021 Individual Income Percentile by Age Calculator
rah Flood, Miriam King, Renae Rodgers, Steven Ruggles, J. Robert Warren and Michael Westberry. Integrated Public Use Microdata Series, Current Population Survey: Version 9.0 [dataset]. Minneapolis, MN: IPUMS, 2021. https://doi.org/10.18128/D030.V9.0
To see our "worker" screen, read the 2021 individual income bracket post. Total income comes from many sources: here's a list.
To see the number of data points and estimated number of workers by age, see the income by age post. To narrow to just wage income, see the salary percentile by age calculator.
Individual Income Percentile by Age Calculators for Past Years
To see past editions of the income percentile by age calculator, here are the archives:
- 2020 US Individual Income by Age Calculator
- 2019 US Individual Income by Age Calculator
- 2018 US Individual Income by Age Calculator
- 2017 US Individual Income by Age Calculator
- 2016 US Individual Income by Age Calculator
- 2015 US Individual Income by Age Calculator
- 2014 US Individual Income by Age Calculator
- 2013 US Individual Income by Age Calculator
Want more? Also see our net worth calculator and net worth by age calculator.
