
I won't bury the lede: the all time closing high on the S&P 500, adjusted for inflation and reinvested dividends, was on July 15, 2019.
Friday's close (July 19, 2019) was a mere 1.23% below that peak .
The S&P 500 Through July 2019
After Christmas Eve 2018 we talked about how the S&P 500 - intraday - dipped to the definition of a bear market. It temporarily dropped 20% below its nominal all time high.
We've since completely erased that bear, even with the currently looming economic issues here in the US (for starters, a Federal Reserve about to cut rates and an inverted yield curve).
That lull now looks like a pothole in an otherwise stereotypical up and to the right graph 📈:
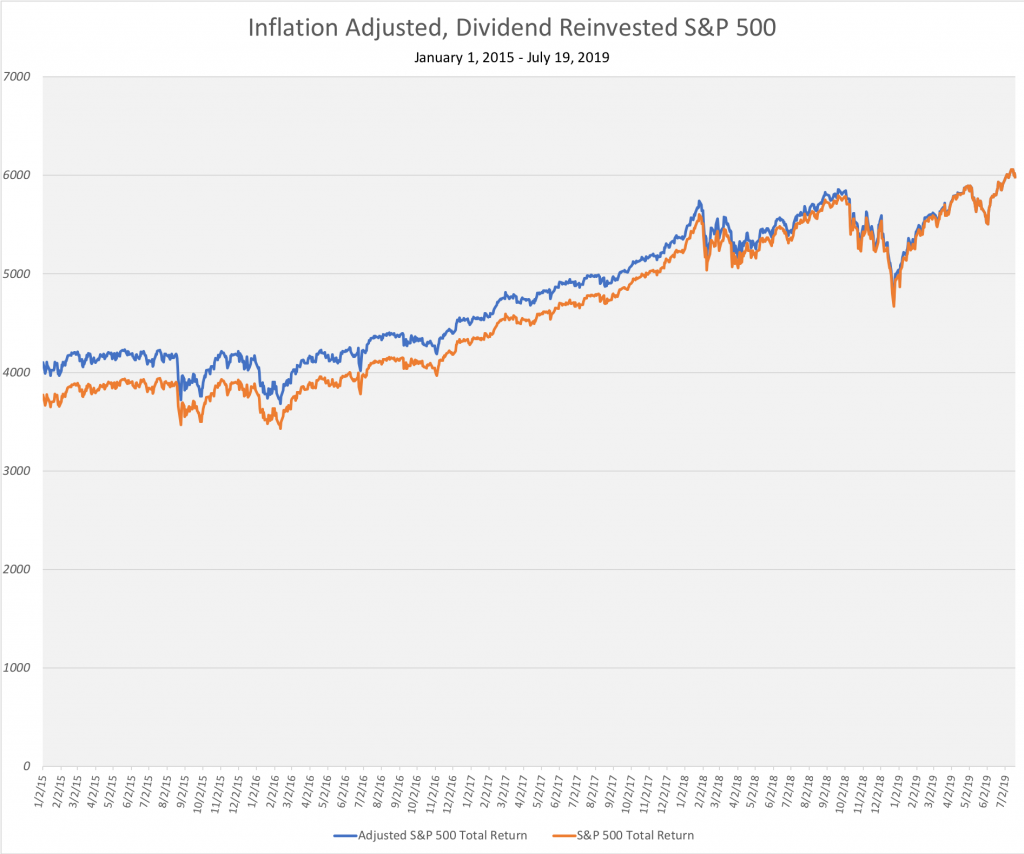
(Above, blue is the adjusted "index" level and orange is the un-adjusted.)
In fact, by this math we left the bear market on April 19, 2019. The journey hasn't been entirely smooth since that time – note the volatility increase you can actually see. We can say one thing for certain though: the brief bear market did not affect the general trend of the market.
But you already know that part. I just wanted to show you that we're at an all time high even adjusted for dividends and inflation.
Floating Near an All Time S&P 500 High
So, even with a bit of weakness last week we're still sitting near an ATH.
Why bother doing this math?
Frustratingly, even in 2019, the most commonly watched investing numbers revolve around index levels. As you know, dear reader, you don't (only) make or lose money off the level of an index.
There are two major oft-ignored investment factors:
- Dividends: what stocks pay out doesn't show up in index levels, but does show up in your wallet
- Inflation: even if the value of your investments are increasing, it doesn't help if the prices of things you buy are increasing faster
(Okay, taxes too - but with worldwide readership on DQYDJ plus all of the various retirement accounts that's a hairy one)
Anyway, that's why we do this math – it's more informative to look at investment results factoring in real world factors like dividends and inflation.
For the newer readers, over the years we've built a number of calculators with this philosophy in mind:
- S&P 500 Return Calculator
- Dow Jones Return Calculator
- Treasury Return Calculator
- Our other investment calculators
- (many include inflation, all contain dividend or coupon reinvestment if applicable)
And what are you going to do about US stocks?
Earlier this year we laid out our current asset allocation. I told you then we were targeting around 60/40 risky/safe assets. We're in our mid-thirties, so that's a conservative allocation.
The stock market success and company equity vest have pushed us past 70/30. I'm looking at trimming it a bit and pocketing 2%+ money market and safe fund returns for now. 2% returns are presumably temporary with the Fed rate cut on the horizon, so hold me to investing hard if we do see weakness.
It's going to be an interesting next 12 months! In the comments, let us know how you're approaching the current market.
