
s page is a net worth percentile by age calculator for the United States. Enter age bracket and household net worth to compare a net worth and age to the overall distribution.
Data backing the tool is explained in the average net worth by age post. Be sure to also note the data warnings there – particularly for upper percentiles.
Need a different tool? See the net worth percentile calculator which aggregates across all ages.
Survey results collected from February, 2019 - Early 2020 from the Federal Reserve SCF.
What was the average and median net worth by age in 2020?
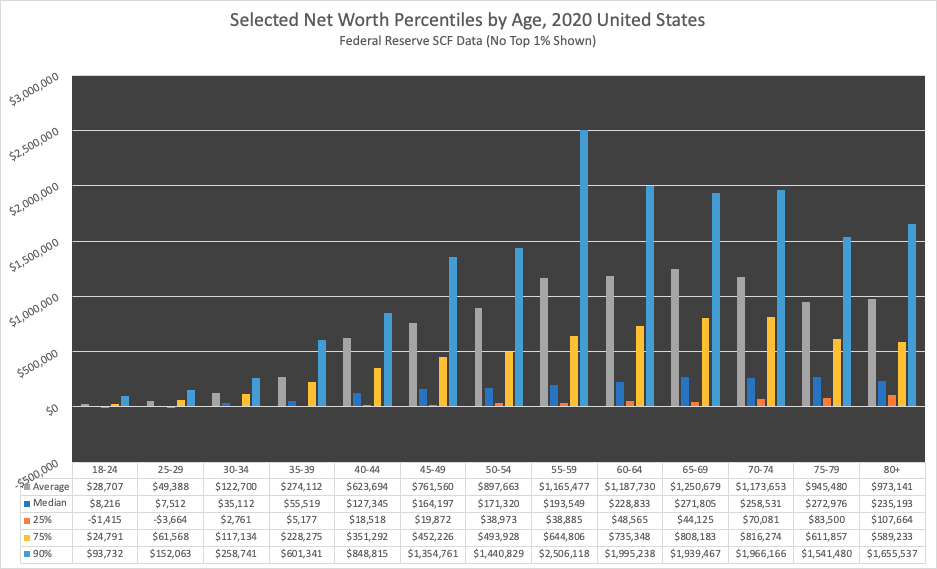
In this chart I've listed the median and average net worth by age, plus the top 1% by age. For completeness, it also includes the 25%, 75%, and 90% net worth by age breakpoints.
| Age | Average Net Worth | Median Net Worth | 25% | 75% | 90% | Top 1% |
| 18-24 | $28,707 | $8,216 | -$1,415 | $24,791 | $93,732 | $435,077 |
| 25-29 | $49,388 | $7,512 | -$3,664 | $61,568 | $152,063 | $606,188 |
| 30-34 | $122,700 | $35,112 | $2,761 | $117,134 | $258,741 | $956,945 |
| 35-39 | $274,112 | $55,519 | $5,177 | $228,275 | $601,341 | $4,034,486 |
| 40-44 | $623,694 | $127,345 | $18,518 | $351,292 | $848,815 | $7,909,637 |
| 45-49 | $761,560 | $164,197 | $19,872 | $452,226 | $1,354,761 | $10,494,100 |
| 50-54 | $897,663 | $171,320 | $38,973 | $493,928 | $1,440,829 | $13,524,094 |
| 55-59 | $1,165,477 | $193,549 | $38,885 | $644,806 | $2,506,118 | $17,545,849 |
| 60-64 | $1,187,730 | $228,833 | $48,565 | $735,348 | $1,995,238 | $14,629,637 |
| 65-69 | $1,250,679 | $271,805 | $44,125 | $808,183 | $1,939,467 | $16,439,046 |
| 70-74 | $1,173,653 | $258,531 | $70,081 | $816,274 | $1,966,166 | $12,625,305 |
| 75-79 | $945,480 | $272,976 | $83,500 | $611,857 | $1,541,480 | $12,770,142 |
| 80+ | $973,141 | $235,193 | $107,664 | $589,233 | $1,655,537 | $9,932,353 |
Note: Especially for the upper net worth percentiles, there is less reliable data and you need to accept some error. See the net worth by age data post for more details and a count of samples per bracket.
Here's how it looks (sans-the top 1%):
Source and Methodology on the 2020 Individual Income Percentile by Age Calculator
Find the deeper writeup in the net worth average, median, and percentile by age post. Especially note the complexities around the younger age groups (especially 18-24).
Data comes from the Federal Reserve's 2019 SCF which was released in September, 2020. That data consists of surveys conducted between February 2019 and April 2020.
Past versions of the tool:
Want more comparison tools? Also see our household income percentile calculator, income percentile calculator, and income percentile by age calculator.
