
Below is a net worth by age percentile calculator for the United States in 2016 (find the newest net worth by age calculator here). Enter net worth and the age of a household's primary earner for a net worth percentile estimate to nearest one percent. Below the tool, see average net worth by age, median net worth by age, and top 1%.
Afterwards: see the overview of net worth brackets or the aggregated net worth percentile calculator.
Net Worth By Age Calculator for the United States
What is the average net worth by age in America? (And median)
Below we've calculated the median and average net worth for all ages in the United States.
We made two calculations: net worth including a home, then another without a house.
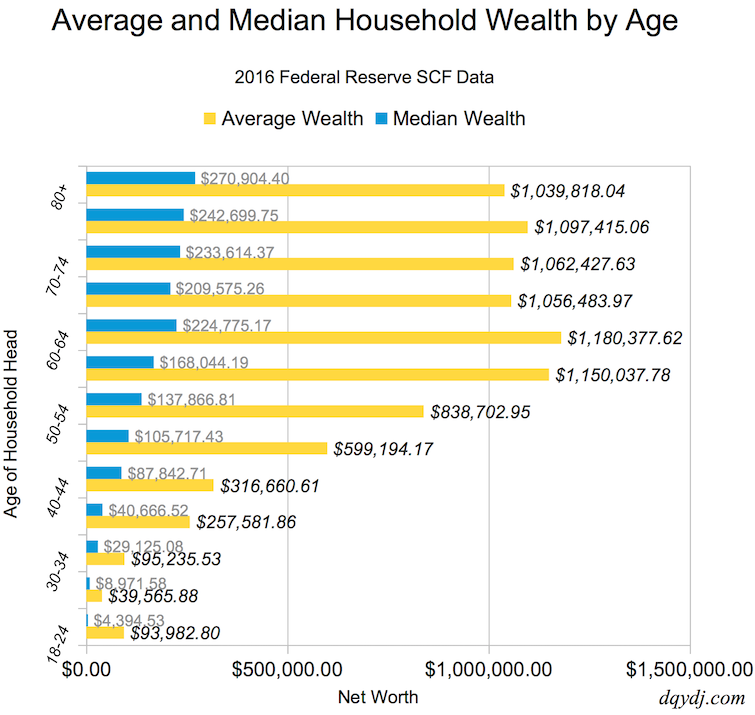
Average Net Worth by Age
Average net worth ranges from $93,982.80 for 18-24 year olds all the way up to $1,180,377.62 for 60-64 year olds. This table lists the average and median net worth for all the ages in the United States:
| Age | Average Net Worth | Median Net Worth |
| 18-24 | $93,982.80 | $4,394.53 |
| 25-29 | $39,565.88 | $8,971.58 |
| 30-34 | $95,235.53 | $29,125.08 |
| 35-39 | $257,581.86 | $40,666.52 |
| 40-44 | $316,660.61 | $87,842.71 |
| 45-49 | $599,194.17 | $105,717.43 |
| 50-54 | $838,702.95 | $137,866.81 |
| 55-59 | $1,150,037.78 | $168,044.19 |
| 60-64 | $1,180,377.62 | $224,775.17 |
| 65-69 | $1,056,483.97 | $209,575.26 |
| 70-74 | $1,062,427.63 | $233,614.37 |
| 75-79 | $1,097,415.06 | $242,699.75 |
| 80+ | $1,039,818.04 | $270,904.40 |
Average Net Worth by Age (Not Including a Primary Home)
(Even though we ran numbers both ways, you should include your primary residence in your net worth calculation).
| Age | Average Net Worth (No Home) | Median Net Worth (No Home) |
| 18-24 | $86,952.25 | $4,012.26 |
| 25-29 | $16,941.07 | $4,397.11 |
| 30-34 | $58,702.34 | $15,980.13 |
| 35-39 | $202,975.63 | $17,247.23 |
| 40-44 | $231,092.29 | $36,392.69 |
| 45-49 | $459,091.51 | $50,462.52 |
| 50-54 | $701,558.76 | $50,154.48 |
| 55-59 | $979,492.18 | $69,338.65 |
| 60-64 | $985,790.54 | $105,875.74 |
| 65-69 | $871,948.49 | $94,665.45 |
| 70-74 | $861,025.60 | $77,472.59 |
| 75-79 | $887,051.06 | $69,551.59 |
| 80+ | $826,304.45 | $121,563.27 |
Top One Percent Income by Age
We previous wrote on the top one percent in the United States – but as you'd expect it varies by age. Older Americans have had more time to amass wealth so have harder and harder thresholds for the top one percent net worth.
Here is the top one percent new worth in America by age, with and without a primary residence:
| Age | Top One Percent Net Worth | Top One Percent Net Worth (No Home) |
| 18-24 | $977,348.20 | $939,682.28 |
| 25-29 | $685,255.69 | $384,565.71 |
| 30-34 | $922,445.16 | $730,793.54 |
| 35-39 | $2,307,300.12 | $1,981,943.23 |
| 40-44 | $2,864,334.14 | $2,593,198.67 |
| 45-49 | $9,666,729.57 | $6,650,285.48 |
| 50-54 | $14,746,583.81 | $13,761,137.50 |
| 55-59 | $14,590,118.46 | $14,026,472.57 |
| 60-64 | $16,161,058.98 | $13,418,073.59 |
| 65-69 | $12,315,188.40 | $11,428,415.50 |
| 70-74 | $11,673,570.56 | $10,042,082.91 |
| 75-79 | $13,865,072.71 | $12,899,231.61 |
| 80+ | $11,783,806.33 | $11,034,430.72 |
What is Net Worth?
Net worth is the most important number in personal finance – your value today assuming you sold everything and paid off all your debts. Combining net worth with age is better still.
How do you calculate your net worth?
To calculate your net worth, first add up the dollar value of all of your assets. That includes your home, car, all bank accounts, brokerage accounts, retirement accounts, and other things of value.
Next, subtract the sum of all of your debts. This category includes your mortgage, credit card debts, student loans, personal loans, and everywhere else you owe money.
That final number is your net worth. With your net worth and age, you can compare your performance with the average, median, and other wealth percentiles on this page.
For a simpler way, sign up for the tool Personal Capital for free. They automatically track all of your assets and debts, and even project your retirement income.
Accredited Investors in America Based on Net Worth and Age
Net worth is the primary way investors become Accredited Investors. These investors can access special investments - hedge funds, venture capital, private equity, and other investments and placements such as franchises.
Our estimates of Accredited Investors by age vary between .52% of households headed by a 25-29 year old up to 16.5% for 80+ years old. Want more? See our post on the number of accredited investors in America.
Why Care About Net Worth By Age?
When discussing net worth, there's a tendency to compare wealth across age groups without any consideration about whether that's appropriate. It isn't, for a number of reasons:
- Older people heading households are more likely to have spouses.
- Age is a reasonable proxy for job experience and skills, and experience commands higher pay.
- Households headed by older people have been accumulating wealth longer.
There is a skew towards wealth being held by older folks, which should be the case if a society is producing wealth. This makes cross age wealth comparisons dubious at best - it's best to compare relative wealth within peer groups. Hence the calculator!
Always remember one inevitable fact: people get older. The households with 18-24 year olds heading them will eventually be headed by 60-64 year olds, with additional (or different) household members. Since you can't relive past years, cross-age comparisons don't make as much sense. Your 35 year old self can't accumulate for 25 year old you. However, you can save for you at 38.
We suggest keeping an eye on relative wealth among your peers, or wealth between adjacent age groups. One simple way is to sign up for Personal Capital for free and have them track your wealth and income.
Good luck with your wealth accumulation!
Similar Tools and Research
- Read our millionaires in America post.
- For income, try the individual income calculator.
- Or to split income by age, use the individual income by age calculator.
Methodology and Source on the Net Worth by Age Calculator
Data comes from the 2016 Federal Reserve SCF, first released in September, 2017. For a full discussion on our net worth methodology, see our net worth brackets page. The net worth percentile calculator discusses valuing primary home equity. As an important note, remember that we're looking at discrete households here. Especially for younger individuals, if an adult is living in another home their net worth is rolled up with the primary earner.
We are also in debt to Anthony Damico and his online R analysis booklet ASDFree. It makes SCF analysis much smoother - please check it out if you're interested in running these calculations yourself.
Net Worth by Age Calculator Data Quality
Due to popular demand, we shifted the age range breakdown from the 2013 Age Percentile Calculator. We now include 13 age ranges, carefully selected to shine a better light on (common) retirement brackets. Note that our divisions are finer than the Fed's choices, some of these brackets are relatively sparse in data points. Especially when looking at the lowest and highest percentages, keep the uncertainty in mind.
Here are the number of data-points and corresponding estimated American households in each age bucket:
| Age Group | Estimated Households | Datapoints |
| 18-24 | 6,200,414 | 205 |
| 25-29 | 8,551,226 | 357 |
| 30-34 | 10,772,092 | 441 |
| 35-39 | 10,173,501 | 492 |
| 40-44 | 11,051,864 | 535 |
| 45-49 | 11,044,607 | 576 |
| 50-54 | 12,056,259 | 658 |
| 55-59 | 12,711,082 | 743 |
| 60-64 | 11,507,120 | 703 |
| 65-69 | 10,390,841 | 577 |
| 70-74 | 7,418,787 | 366 |
| 75-79 | 6,101,274 | 270 |
| 80+ | 8,002,632 | 325 |
| Total | 125,981,701 | 6,248 |
(Data-points here are actual survey responses in the public set, not the total number in all replicates.)
For a past comparison, check out our archived calculator for 2013.
