
In a recent post we looked at the relationship between recessions and bear markets. In this post we'll take it a step further and look at the relationship between the Federal Funds Target Rate and bear markets.
Specifically, we'll look at hiking cycles (as the Federal Reserve was in December 2018) versus S&P 500 bear markets.
Increasing the Federal Funds Rate
The Federal Reserve in the United States conducts open market operations to achieve declared monetary policy results. The US trifecta of policy targets include maximum employment, stable prices (defined as roughly 2% annual inflation), and moderate long-term rates.
The Fed, as it is often abbreviated, achieves these aims through open market operations. These operations include changing the overnight lending rate to banks, large scale asset purchases (and sales), and all sorts of other monetary tools.
Their headline tool is the federal funds rate. As a baseline rate, it sets a floor on short term interest rates and affects interest rates economy-wide (and across a variety of time-frames).
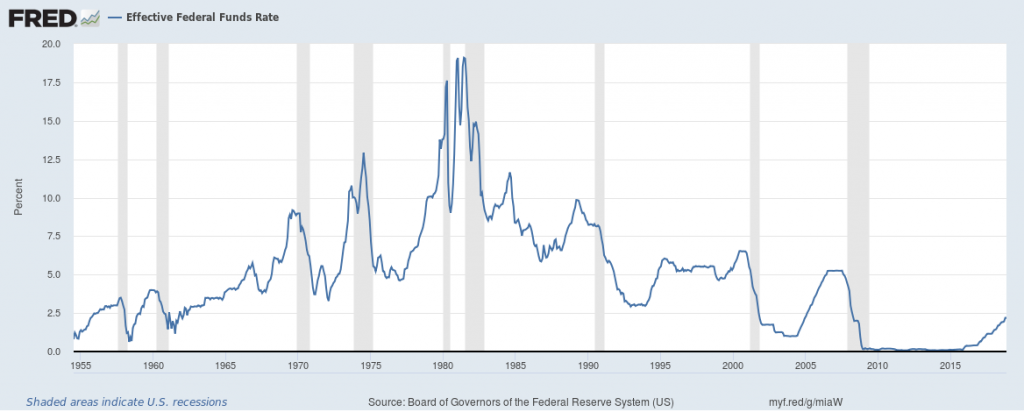
Currently, the Federal Reserve is in a hiking cycle - rates are on the way up. After dropping rates to 0% to 0.25% during the Great Recession, rate targets scraped zero until December 2015. As of December 2018, the federal funds target rate is now 2.25% to 2.5%. The Federal Reserve projected 2 additional rate hikes in 2019.
The Federal Funds Rate vs. The Stock Market
Does the target rate affect the stock market and investment allocation? You better believe it!

In essence, the target rate sets a risk free rate for depository institutions (think: banks lending to banks).
When rates are low, cash doesn't make any money "sitting" there, so in a well-functioning economy people pull their cash to make investments in... anything else. To wit: the large gains in the S&P 500 and other assets such as housing since the Great Recession's bottom.
Using data on the S&P 500 since 1950 (yes, we know - the current "size-500" index started in 1957, humor us!) and the federal funds rate we set out to see the relationship. We particularly were interested in hiking or tightening periods - when the Fed is increasing the funds rate. There comes a point when people will move investments from riskier assets to safer assets like bonds and cash.
| Bear Market Start | Associated Hiking | Start Hikes | Bear Start Effective | Start Effective | Max Drawdown |
| 10/21/57 | TRUE | 0.50% | 3.50% | 11/17/54 | -21.47% |
| 05/28/62 | TRUE | 1.00% | 2.75% | 05/04/61 | -29.31% |
| 08/29/66 | TRUE | 1.00% | 5.50% | 05/04/61 | -23.69% |
| 01/26/70 | TRUE | 4.00% | 9.00% | 11/21/67 | -37.27% |
| 11/26/73 | TRUE | 5.00% | 9.75% | 11/16/71 | -49.93% |
| 09/25/81 | FALSE | - | - | - | -28.01% |
| 10/19/87 | TRUE | 5.66% | 6.75% | 08/19/86 | -35.94% |
| 10/11/90 | FALSE | - | - | - | -20.36% |
| 09/01/98 | FALSE | - | - | - | -22.45% |
| 02/22/01 | TRUE | 4.75% | 5.50% | 11/17/98 | -50.50% |
| 07/01/08 | FALSE | - | - | - | -57.69% |
| 12/24/18 | TRUE | 0.50% | 2.40% | 12/17/15 | -20.06% |
We've generally used The Balance's excellent history of rate targets plus old fashioned "personal interpretation" to categorize the cycles. All of this difficulty is compounded because the Fed hasn't always publicly communicated target rates(!).
The art is looking at the effective fed rate – the revealed fed funds rate – and divining if we were in an easing, tightening, or pause cycle.
Let's discuss the four bear markets which we judged weren't associated with hiking cycles.
September 1981 Bear Market and Federal Reserve Rates
September 1981's bear market was a wild one. The effective federal funds rate bounced off 20%(!) a few times in the months and years previous, but the Fed was easing by the time we entered that S&P 500 bear.
On September 25, the effective funds rate stood a bit south of 15%. The bear was relatively mild, and bottomed out at a 28.01% drop from peak.
October 1990 Bear Market and Federal Reserve Rates
Just as in 1981, the Fed was a bit too aggressive during the preceding hiking cycle and was currently easing before we hit a bear market. In 1989 we saw effective federal funds rates of almost 10%, but by October 1990 we were down to around 9%.
It wasn't enough to prevent the bear, however. The market just barely cleared the bear threshold at 20.36% down from the all time high. The Fed continued to ease all the way into 1992 where they paused at around the 3% level.
September 1998 Bear Market and Federal Reserve Rates
September 1998 is an interesting case study. The Federal Reserve was actually in something of a pause - floating between a 5.5% and 6.0% effective rate from late 1994 all the way into the bear.
Still, even without a recession and despite no change in effective federal funds rates the S&P 500 cleared the bear threshold with a 22.45% drawdown. The Fed reacted with a minor cut and all was well... until the tech bubble popped a few years later. That drop touched a whopping 50.5%.
July 2008 Bear Market and Federal Reserve Rates
July 2008, as you're probably aware, was the beginning of the bear market associated with the Great Recession. Seeing cracks in the economy, the Federal Reserve had already started to ease way back in August 2007 - dropping from around 5.25% or so effective to around 2.0%.
As you well know, this time was different and we had (hopefully!) a generationally terrible recession. The Fed had to ease all the way to the zero rate bound at 0% (some countries went negative!) and add other extraordinary tools to their repertoire to try to get a handle on the economic slump.
The rest is history - at worst, a -57.69% drawdown in the S&P 500. It's also the most recent recession anyone in the US remembers... and surely will affect market psychology whenever we see the next recession.
What Can We Say About Federal Reserve Target Rate Policy and Stock?
We can say exactly what you'd expect about Federal Reserve policy, especially during hiking cycles: the federal reserve funds rate affects stock.
For three bears, the Federal Reserve was easing after a hiking cycle or pause, but not enough to avoid a bear. In a fourth bear market, the Fed had paused for 4 years and eased slightly after the market fell.
In all other cases, a hiking cycle eventually observed a bear. As you see in our recession and bear market post, that doesn't necessarily mean recession - oh, no. Call it what you will - uncertainty, valuation changes, repricing of risk, or a market tantrum - but hiking cycles and bear markets don't always precede recessions.
Interested in Federal Reserve rate policy? We have a Taylor Rule calculator which shows a 'suggested' fed funds rate.
What do you think will happen next? Is the bear market over? Will we retest the lows in the S&P 500 and other indices?
