
Remember the yield curve inversion? Yeah me too.
For most of 2019 until October (when the Federal Reserve cut overnight lending rates for the third time that year) a significant part of the yield curve was inverted.
On January 21, 2020, Treasury debt in the 3 year range started yielding less than terms under a year. And on the 24th, longer terms inverted such as the 5 year-3 month spread.
What do yield curve inversions mean?
To start, the inversion might mean nothing, or be a reflection of outbreak fears.
The Federal Reserve's cuts in October quieted down a significant proportion of the curve, and most of the United States's economy continues to hum along. In the news right now is the outbreak of a previously unseen coronavirus in Wuhan, China deemed the 2019-novel coronavirus (2019-nCoV).
Regardless of the immediate cause, in a yield curve inversion, shorter term duration debt pays more than longer term debt. In a properly functioning Government debt market, the opposite is true – risk and uncertainty increase with time, so a healthy yield curve slopes up if duration is on the X-Axis and yield on the Y-Axis.
Historically – since the Federal Reserve was founded in 1913, anyway – a yield curve inversion generally precedes a recession (with a few exceptions). Usually, folks watch the 10 year - 2 year spread, although the 10 year - 3 month is probably even better as an indicator.
You can find Treasury debt yields here from (appropriately) the U.S. Department of the Treasury.
Measuring Yield Curve Inversion Completeness
I've been playing with a measure that looks at the "percentage" of the yield curve that is currently inverted.
The Treasury tracks various "constant" durations from 1 month to 30 years, and I looked at every discrete spread as a boolean since 1990 to find the yield curve was 26% inverted on 1/24/2020. (That's up from 5% as recently as 1/17/2020.)
Interested to see what it looks like?
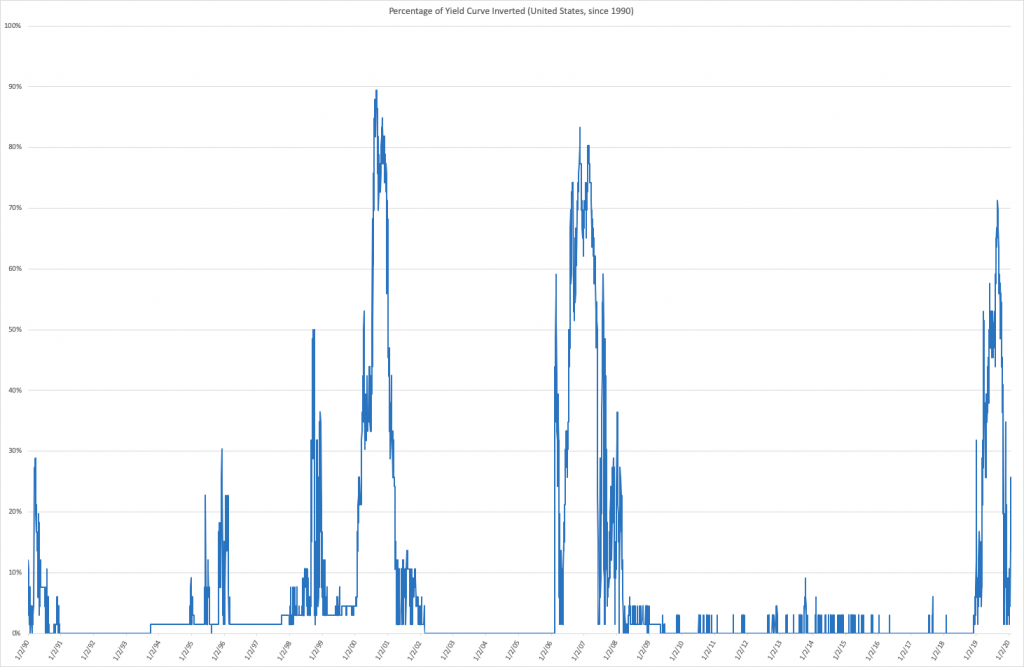
I know, I know. Go here to see the NBER's recession timeframes. Here's where they would be:
- July 1990 - March 1991
- March 2001 - November 2001
- December 2007 - June 2009
Not every series is carried through the series, so I'm inappropriately using some terms. However, it really shows how much of an outlier last year's inversions will be if we don't end up in a recession in the relatively near term.
Yield Curve Inversion Percentage
Of course, the yield curve is – in a sense – continuous. That combined with the interpolation and extrapolation necessary to create the measure means it's not perfect. Additionally, the inversion on something like the 20 year and 10 year ignores a lot of years in between.
But – this feels like a decent take.
With all that in mind, I'm looking at turning this into a tool soon. (Sit tight.) Maybe I'll even add weights or let you turn off some observations.
My Take on the Yield Curve
I hesitate to offer a take... this economy keeps humming.
I'm not saying the business cycle is dead, just that I'm positioning myself in ways where I won't mind (as much, if we're being honest) what the market conditions are. And don't forget – Australia hasn't seen a recession for 30 years.
(How's that for a dodge?)
