
On this page is a household income percentile calculator for the United States for 2019. Enter pre-tax (gross) household income earned between January and December 2018 to compare to household income percentiles in the full year.
You can find the methodology in the United States average income, median income, and income percentile post.
Afterwards, visit the income percentile by state and income percentile by city calculator. Or, try the individual income calculator.
Household Income Percentile Statistics in 2019
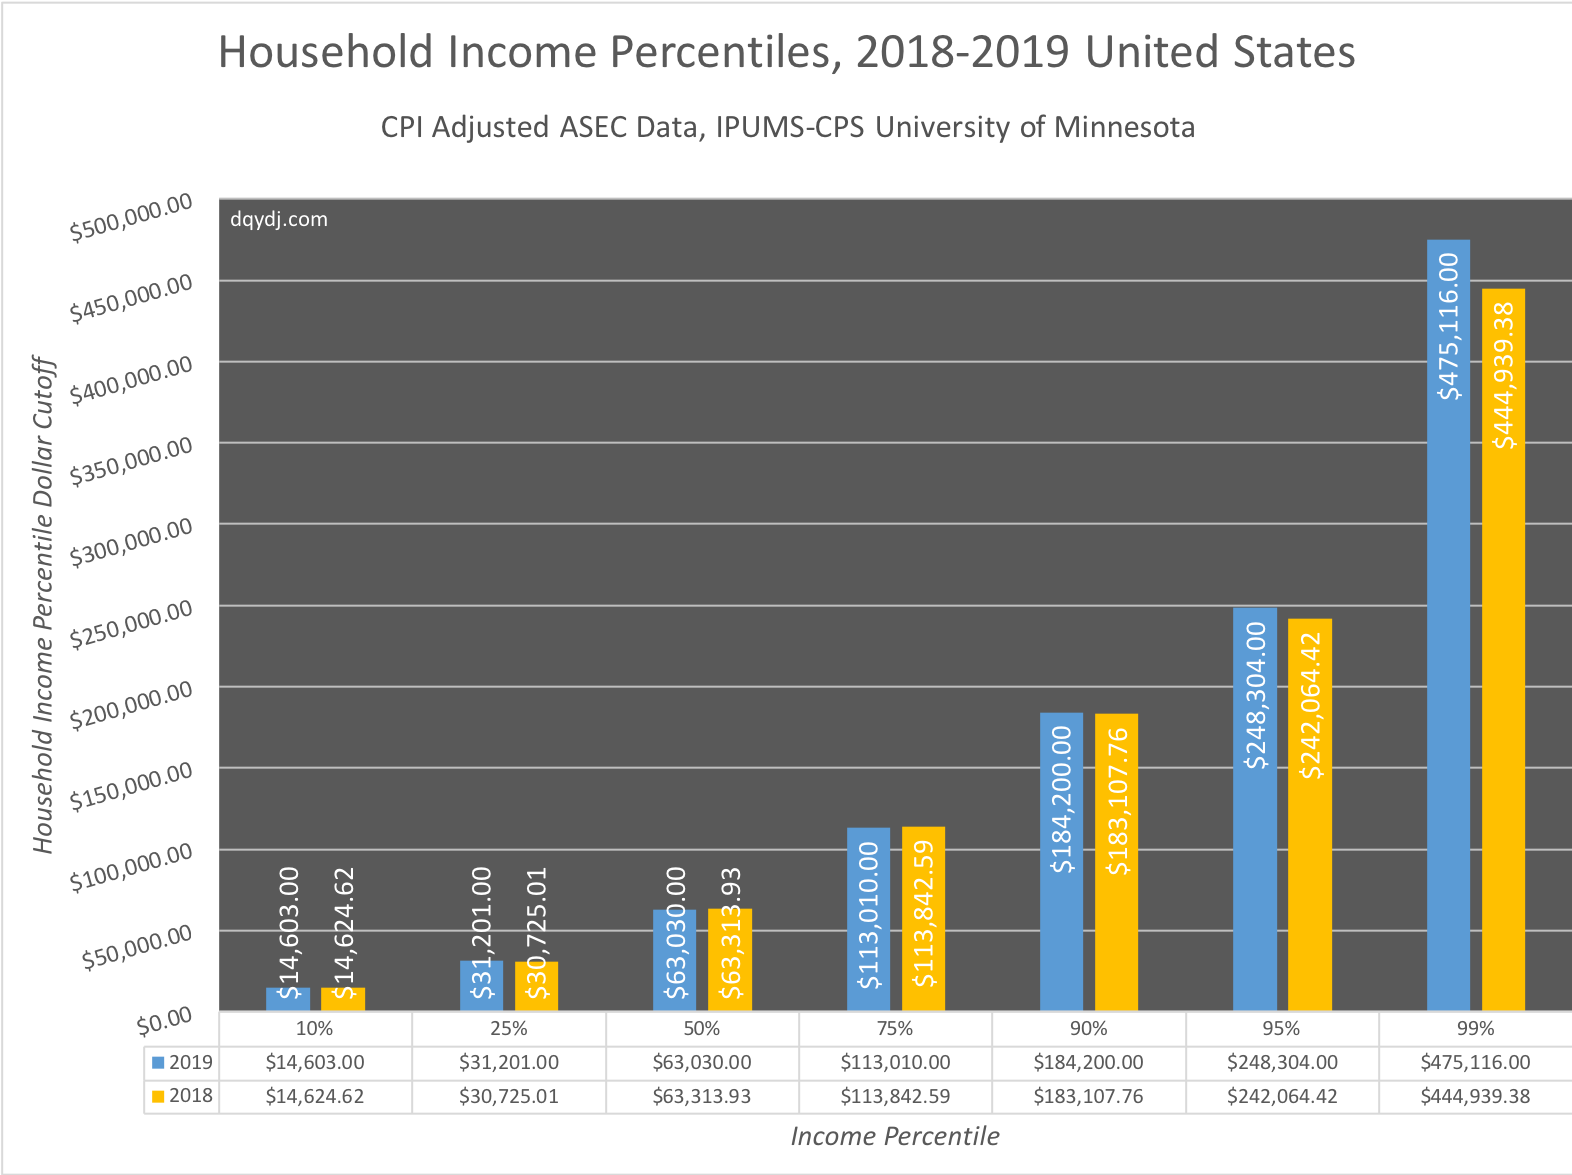
In our last post on household income brackets and summary statistics, I made a graph comparing some income percentiles year over year. Here's what the household icome brackets look like for the 10th, 25th, 50th, 75th, 90th, 95th, and 99th (top 1%) percentiles:
What was the United States average household income?
In 2019, average household income in the United States was $89,930.70.
What was the United States median household income?
In 2019, median household income in the United States was $63,030.00.
How many US households made $100,000 or more in 2019?
In 2019, about 39,162,447 households (30.4% of households) in the United States made $100,000 or more.
How many US households made $250,000 or More in 2019?
In 2019, about 6,365,893 households (4.9% of households) in the United States made $100,000 or more.
What was the top 10% household income percentile in 2019?
The threshold to be in the top 10% of household incomes in 2019 in the United States was $184,200.
What was the top 5% household income percentile in 2019?
The threshold to be in the top 5% of household incomes in 2019 in the United States was $248,304.00.
What is the top one percent household income in the US in 2019?
To be top 1% in the United States in 2019, you had to earn $475,116.00 or more as a household between January and December 2018.
Note: Net worth is a better proxy for the 1% (see our one percent in America article), yet most often one-percenter refers to income.
What other calculators do you have?
Thanks for being a reader! Want more calculators and interactive tools?
See our individual income by age calculator and individual income calculator. Also see our net worth calculator and net worth by age calculator.
Or, drink from the firehose on our calculator roundup page!
Source and Methodology on the 2018 Household Income Percentile Calculator
Sarah Flood, Miriam King, Renae Rodgers, Steven Ruggles and J. Robert Warren. Integrated Public Use Microdata Series, Current Population Survey: Version 6.0 [dataset]. Minneapolis, MN: IPUMS, 2019. https://doi.org/10.18128/D030.V6.0
See the household income bracket article for details on methodology (but household income is very straightforward.
Care about annual changes? We're done household income calculator posts since 2016. Here are the archived calculators:
- 2018 US Household Income Calculator
- 2017 US Household Income Calculator
- 2016 US Household Income Calculator
Make sure you adjust for inflation.
How did your household income stack up to the household income distribution in 2019?
