
Below is an individual income percentile calculator for the United States for 2019. Enter gross, pre-tax income earned by one person in full-year 2018 to compare to the US individual income distribution. (For a complete picture, see the household income calculator).
After try our income percentile by state and income percentile by city calculators.
(Math and methodology in our average, median, and top 1% individual income post)
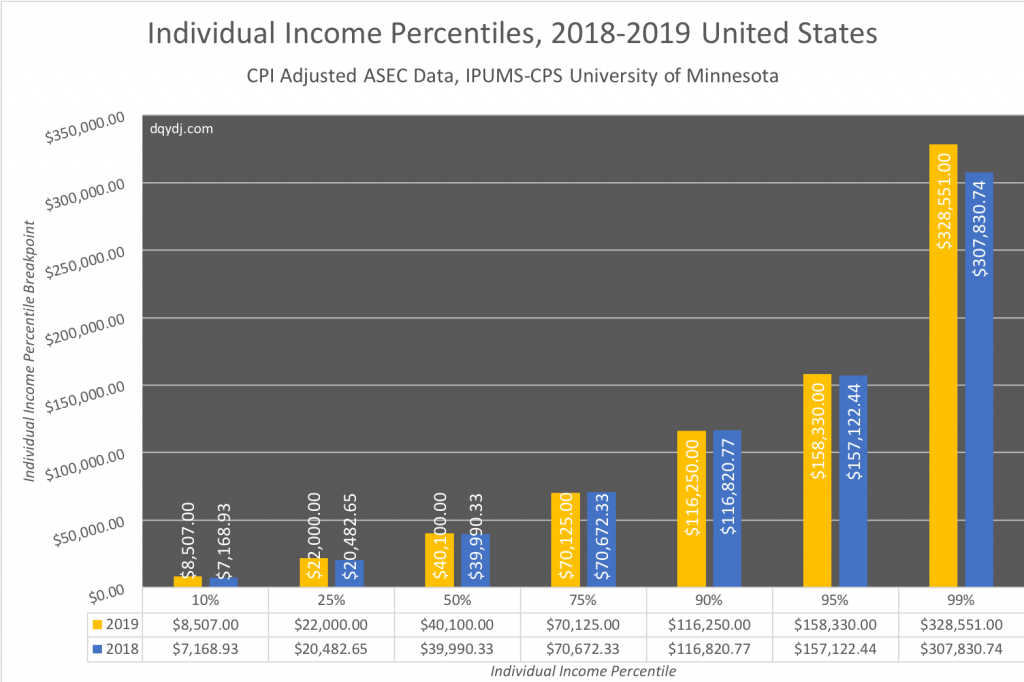
Individual Income Percentiles for the US Income Distribution in 2019
In this graph we developed for the average individual income post, we compare single-person earnings between 2019 and 2018. 2018 numbers are CPI adjusted.
(Again, this means "full-year 2018" and "full-year 2017", respectively. See the note in the average income post.)
What was the median individual income in 2019?
In the United States, median individual income was $40,100.00 in 2019.
What was the average individual income in 2019?
In the United States, average individual income in the United States was $58,379.45 in 2019.
What was the top 1% individual income in 2019?
The United States threshold for a top 1% individual earner was $328,551.00 in 2019.
In 2019, what was the threshold for the top 10% individual income in the United States?
Top 10% of individual earnings started at $116,250.00 in the United states in 2019.
In 2019, what was the threshold for the top 5% individual income in the United States?
Top 5% of individual earnings started at $158,330.00 in the United states in 2019.
What other calculators do you have?
Thanks for asking! We have quite a few:
Net worth is in many ways a better measure of how well-off a household is. Income measures how much money comes in, but net worth measures wht you keep and grow. Try our net worth calculator and net worth by age calculator.
For a different slice of the same dataset, try our individual income by age calculator and household income calculator.
Individual Income Benchmarks in 2019
People love round numbers - I get it. Now let's talk about how often people make the big benchmarks as an individual.
Take the exact numbers with a grain of salt (beware of false precision!). Just look at the absolute number as the rough number of workers who cleared the threshold.
How many people made $50,000 or more in 2019?
41.7% of workers, or around 72,624,482 people in the United States made $50,000 or more in 2019.
How many people made $100,000 or more in 2019?
"Six-figure income" is a common target income in the United States, and one which around 1/8th of workers hit. 13.8% of workers, or around 24,129,891 people in the United States made $100,000 or more in 2019.
How many people made $250,000 or more in 2019?
1.9% of workers, or around 3,365,738 people in the United States made $250,000 or more in 2019.
How many people made $500,000 or more in 2019?
.5% of workers, or around 801,705 people in the United States made $500,000 or more in 2019.
How many people made $1,000,000 or more in 2019?
Usually when we talk about millionaires we're talking about net worth. However, ~.2% of workers – around 320,533 people in the United States – made $1,000,000 or more in 2019.
What is considered a good individual income?
A good income in the United States started around $46,000 in 2019. That's the median individual income for a person who typically worked 40 or more hours per week. A better income is $75,875, which started the 75th percentile of earnings for 40+ hour workers.
These numbers are obviously very location dependent. What's good at the country level does not necessarily translate to where you live. For example, in San Francisco County a family of 4 would be considered very low income at $75,875.
Live somewhere expensive? We've got you covered: see the income percentile by city and income percentile by state calculators for numbers in your area.
Source and Methodology on the 2019 Individual Income Percentile Calculator
Sarah Flood, Miriam King, Renae Rodgers, Steven Ruggles, and J. Robert Warren. Integrated Public Use Microdata Series, Current Population Survey: Version 6.0 [dataset]. Minneapolis, MN: IPUMS, 2019. https://doi.org/10.18128/D030.V6.0
For methodology, please see the individual income bracket post. The only additional screens in this calculator were for workers reporting 30+ and 40+ hours a week or work, respectively.
Want to see changes over time? Try our calculators from years past:
- 2018 US Individual Income Calculator
- 2017 US Individual Income Calculator
- 2016 US Individual Income Calculator
- 2015 US Individual Income Calculator
- 2014 US Individual Income Calculator
How did your individual income rank in 2019 vs. 2018?
