
In the United States, there are regulation-driven investor classifications that dictate how private funds work – and, importantly, who can invest in those funds. The three most important investor classifications are the accredited investor, the qualified client, and the qualified purchaser. Depending on fund requirements, these categories limit private investments to somewhere between 2% and 10% of American households.
In. this post, we'll briefly look at the differences between the three and where they might matter, then take a look at the demographic breakdowns of investors in each class by education, race, age, and family status.
Accredited Investors vs. Qualified Clients vs. Qualified Purchasers
I've written about each of the three main individual investor designations separately, but here's a general breakdown of what a household needs in each case. Note that each has a few exceptions to qualify, but these are the main criteria for designation listed with the primary reason qualification matters.
- Accredited Investor – $1 million in net worth excluding the equity in a primary home, or $200,000 in individual income, or $300,000 in income with a spouse
- Allows private investments, for a few examples: shares or debt in private companies, participation in PE funds, hedge funds, venture funds, angel syndicates, real estate syndicates, or franchise ownership
- Qualified Client* – $2 million in net worth excluding the equity in a primary home, the ability to invest $1 million with the potential advisor
- Allows participation in funds that charge performance fees, sometimes known as carry, carried interest, promotional fees, or promote
- Qualified Purchaser – $5 million in investments excluding any debt to purchase those investments
- Removes the requirement to cap investment funds at 100 participants when all investors are qualified purchasers
* Note: qualified client requirements are adjusted for inflation every 5 years. By the end of 2021, the requirements will be $2.2 million in net worth or the ability to invest $1.1 million with a manager.
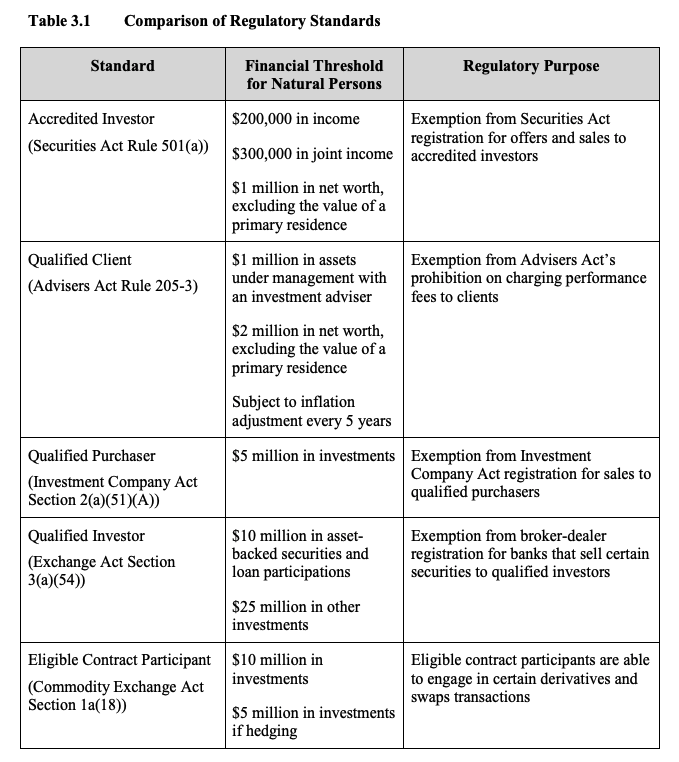
Other Designated Investor Types – Qualified Investors and Eligible Contract Participants
Note that these three classifications aren't the only three – and they aren't even the only three dedicated to individuals. There is a designated investor type known as a qualified investor, and for certain commodity transactions, you need to be an eligible contract participant.
In late 2015, the SEC reviewed the five together; here's their summary:
Investor Regulatory Standard Demographics
Using 2019 Federal Reserve SCF data, I further divided the accredited investor, qualified client, and qualified purchaser statistics by educational achievement, race, age, and family status.
Demographics generally are for the survey's reference person, while the values themselves are households (roughly – more in the methodology section, below). Estimates are low; this is 2019 data (~9% of responses came during the early pandemic), and net worth has increased overall since then.
None of the investor designations in the United States exclude wealth or investments held by a spouse. Please don't ask me to run the numbers for individuals, or by "men vs. women" or so on – it's impossible to disentangle the two, and spousal wealth and assets count in every designation.
Investor Designations by Education
The variable edcl divides the SCF respondents into four groups:
- No High School Diploma/GED
- High School Diploma or GED
- Some College
- College Degree
I've abbreviated the four, but the actual numbers match the full description. Here are the baseline numbers:
| All Households | Households | No High School | High School | Some College | College |
| Number | 128,642,430 | 13,793,730 | 31,496,730 | 36,622,805 | 46,729,170 |
| Percentage | 100.0% | 10.7% | 24.5% | 28.5% | 36.3% |
Accredited Investors by Education
| Accredited Investors | Households | No High School | High School | Some College | College |
| Number | 13,665,475 | 113,149 | 1,167,607 | 1,775,971 | 10,608,749 |
| Percentage | 100.0% | 0.8% | 8.5% | 13.0% | 77.6% |
Qualified Clients by Education
| Qualified Clients | Households | No High School | High School | Some College | College |
| Number | 6,398,420 | 38,319 | 507,569 | 636,737 | 5,215,796 |
| Percentage | 100.0% | 0.6% | 7.9% | 10.0% | 81.5% |
Qualified Purchasers by Education
| Qualified Purchaser | Households | No High School | High School | Some College | College |
| Number | 1,956,090 | 5,194 | 96,091 | 96,535 | 1,758,271 |
| Percentage | 100.0% | 0.3% | 4.9% | 4.9% | 89.9% |
Investor Designations by Race
The variable race lets us divide households by the reference person's self-identified race. There are only four categories in the public set:
- White Non-Hispanic
- Black/African-American Non-Hispanic
- Hispanic or Latino
- Other*
I've narrowed down the columns for size, but they map to the above four categories. Here are the baseline numbers for all households:
| All Households | Households | White | Black | Hispanic or Latino | Other |
| Number | 128,642,430 | 87,471,290 | 20,135,500 | 14,061,115 | 6,974,530 |
| Percentage | 100.0% | 68.0% | 15.7% | 10.9% | 5.4% |
* In the public set 'Other' is recoded; the entire survey question asks: "White, Black or African-American, Hispanic or Latino, Asian, American Indian or Alaska Native, Hawaiian Native or other Pacific Islander, or another race?"
Accredited Investors by Race
| Accredited Investors | Households | White | Black | Hispanic or Latino | Other |
| Number | 13,665,475 | 11,937,313 | 331,097 | 247,422 | 1,149,644 |
| Percentage | 100.0% | 87.4% | 2.4% | 1.8% | 8.4% |
Qualified Clients by Race
| Qualified Clients | Households | White | Black | Hispanic or Latino | Other |
| Number | 6,398,420 | 5,618,588 | 145,258 | 109,346 | 525,230 |
| Percentage | 100.0% | 87.8% | 2.3% | 1.7% | 8.2% |
Qualified Purchasers by Race
| Qualified Purchasers | Households | White | Black | Hispanic or Latino | Other |
| Number | 1,956,090 | 1,782,393 | 18,611 | 27,562 | 127,524 |
| Percentage | 100.0% | 91.1% | 1.0% | 1.4% | 6.5% |
Investor Designation by Age
I break down households by the reference person's age into roughly by five year brackets in my net worth by age series. With the smaller sets (especially among qualified purchasers), it's safer to move to the Fed's breakdown:
- Younger than 35
- 35 to 44
- 45 to 54
- 55 to 64
- 65 to 74
- 75 and older
Here are the baseline age groups in the complete survey:
| All Households | Households | <35 | 35-44 | 45-54 | 55-64 | 65-74 | >=75 |
| Number | 128,642,430 | 26,850,490 | 21,376,205 | 22,072,145 | 24,185,670 | 19,684,925 | 14,473,000 |
| Percentage | 100.0% | 20.9% | 16.6% | 17.2% | 18.8% | 15.3% | 11.3% |
Accredited Investors by Age
| Accredited Investors | Households | <35 | 35-44 | 45-54 | 55-64 | 65-74 | >=75 |
| Number | 13,665,475 | 227,906 | 1,511,899 | 3,080,196 | 3,963,845 | 3,011,204 | 1,870,425 |
| Percentage | 100.0% | 1.7% | 11.1% | 22.5% | 29.0% | 22.0% | 13.7% |
Qualified Clients by Age
| Qualified Clients | Households | <35 | 35-44 | 45-54 | 55-64 | 65-74 | >=75 |
| Number | 6,398,420 | 85,995 | 527,446 | 1,226,014 | 2,148,008 | 1,535,402 | 875,556 |
| Percentage | 100.0% | 1.3% | 8.2% | 19.2% | 33.6% | 24.0% | 13.7% |
Qualified Purchasers by Age
| Qualified Purchasers | Households | <35 | 35-44 | 45-54 | 55-64 | 65-74 | >=75 |
| Number | 1,956,090 | 16,992 | 102,928 | 362,119 | 663,444 | 548,752 | 261,856 |
| Percentage | 100.0% | 0.9% | 5.3% | 18.5% | 33.9% | 28.1% | 13.4% |
Investor Designation by Family Status
The SAS macros define a variable famstruct which divides households into five main categories:
- Not Married/Living with Partner, has Children
- Not Married/Living with Partner, has No Children, Reference Person Under 55
- Not Married/Living with Partner, has No Children, Reference Person 55 or Older
- Married/Living with Partner, has Children
- Married/Living with Partner, has No Children
Here are the baseline statistics for those groups (please forgive my abbreviations!):
| All Households | Households | Not Married/LWP, Kids | Not Married/LWP, No Kids, < 55 | Not Married/LWP, No Kids, >= 55 | Married/LWP, Kids | Married/LWP, No Kids |
| Number | 128,642,430 | 13,986,255 | 19,379,155 | 23,177,520 | 35,722,175 | 36,377,325 |
| Percentage | 100.0% | 10.9% | 15.1% | 18.0% | 27.8% | 28.3% |
Accredited Investors by Family Status
| Accredited Investors | Households | Not Married/LWP, Kids | Not Married/LWP, No Kids, < 55 | Not Married/LWP, No Kids, >= 55 | Married/LWP, Kids | Married/LWP, No Kids |
| Number | 13,665,475 | 403,760 | 422,884 | 1,357,668 | 5,009,912 | 6,471,251 |
| Percentage | 100.0% | 3.0% | 3.1% | 9.9% | 36.7% | 47.4% |
Qualified Clients by Family Status
| Qualified Clients | Households | Not Married/LWP, Kids | Not Married/LWP, No Kids, < 55 | Not Married/LWP, No Kids, >= 55 | Married/LWP, Kids | Married/LWP, No Kids |
| Number | 6,398,420 | 213,463 | 109,764 | 526,898 | 2,116,803 | 3,431,493 |
| Percentage | 100.0% | 3.3% | 1.7% | 8.2% | 33.1% | 53.6% |
Qualified Purchasers by Family Status
| Qualified Purchasers | Households | Not Married/LWP, Kids | Not Married/LWP, No Kids, < 55 | Not Married/LWP, No Kids, >= 55 | Married/LWP, Kids | Married/LWP, No Kids |
| Number | 1,956,090 | 27,438 | 23,098 | 149,833 | 541,677 | 1,214,044 |
| Percentage | 100.0% | 1.4% | 1.2% | 7.7% | 27.7% | 62.1% |
Investor Designation Methodology
You can find more information on adjustments for the public set (the one I use, alas...) in the Fed's 2019 SCF Codebook and SAS macros. All details on methodology are in the original posts (with the demographics layered on top):
All statistics are based on the "reference person," while stats are based on the PEU. Here's what the Fed says about the reference person:
The reference person is taken to be the single core individual in a PEU without a core couple; in a PEU with a central couple, the reference person is taken to be either the male in a mixed-sex couple or the older individual in the case of a same-sex couple.
The PEU is the "primary economic unit" – roughly, the household, with a few differences. I discuss the PEU more in my net worth breakdown post.
Special Designated Investors in America
Because of the relatively high bar to reach most classifications, major differences in access to investments are based upon different demographics. The SEC wants to expand investor access to private investment, and the demographics here show some of their reasoning.
If you're syndicating a fund or are a potential general partner, or have a business where you are raising private capital, these statistics might even suggest opportunity. It's likely that funds chase the larger demographic categories.
If your product of fund speaks to an under-served community of private investors, you likely have a better chance at success or out-performance.
Liked this post? Try some of our other investing and net worth calculators:
