
Here you'll find estimated United States Individual Income Brackets for 2026. Also, find the average, median, and top 1% of individual incomes in the United States.
Incomes are earned between January and December 2025, and data is comprised of individuals who worked (or wanted to work) in 2025.
Individual income benchmarks in 2026
The most important summary statistics for income – whether individual or household – are median, average, and top 1% income.
These statistics are for all workers in the United States, not adjusted for inflation. To limit data to "full time" workers, compare incomes in our individual income percentile calculator.
What was the median individual income?
Median individual income in the United States was $55,584. It is up from $53,010 in 2025.
What was the average individual income?
Average individual income in 2026 in the United States was $82,030.90, up from $77,652.10 in 2025.
What was the top 1% individual income?
A top 1% earner in the United States in 2026 made $507,102 or more. Top 1% is up from $450,100 in 2025.
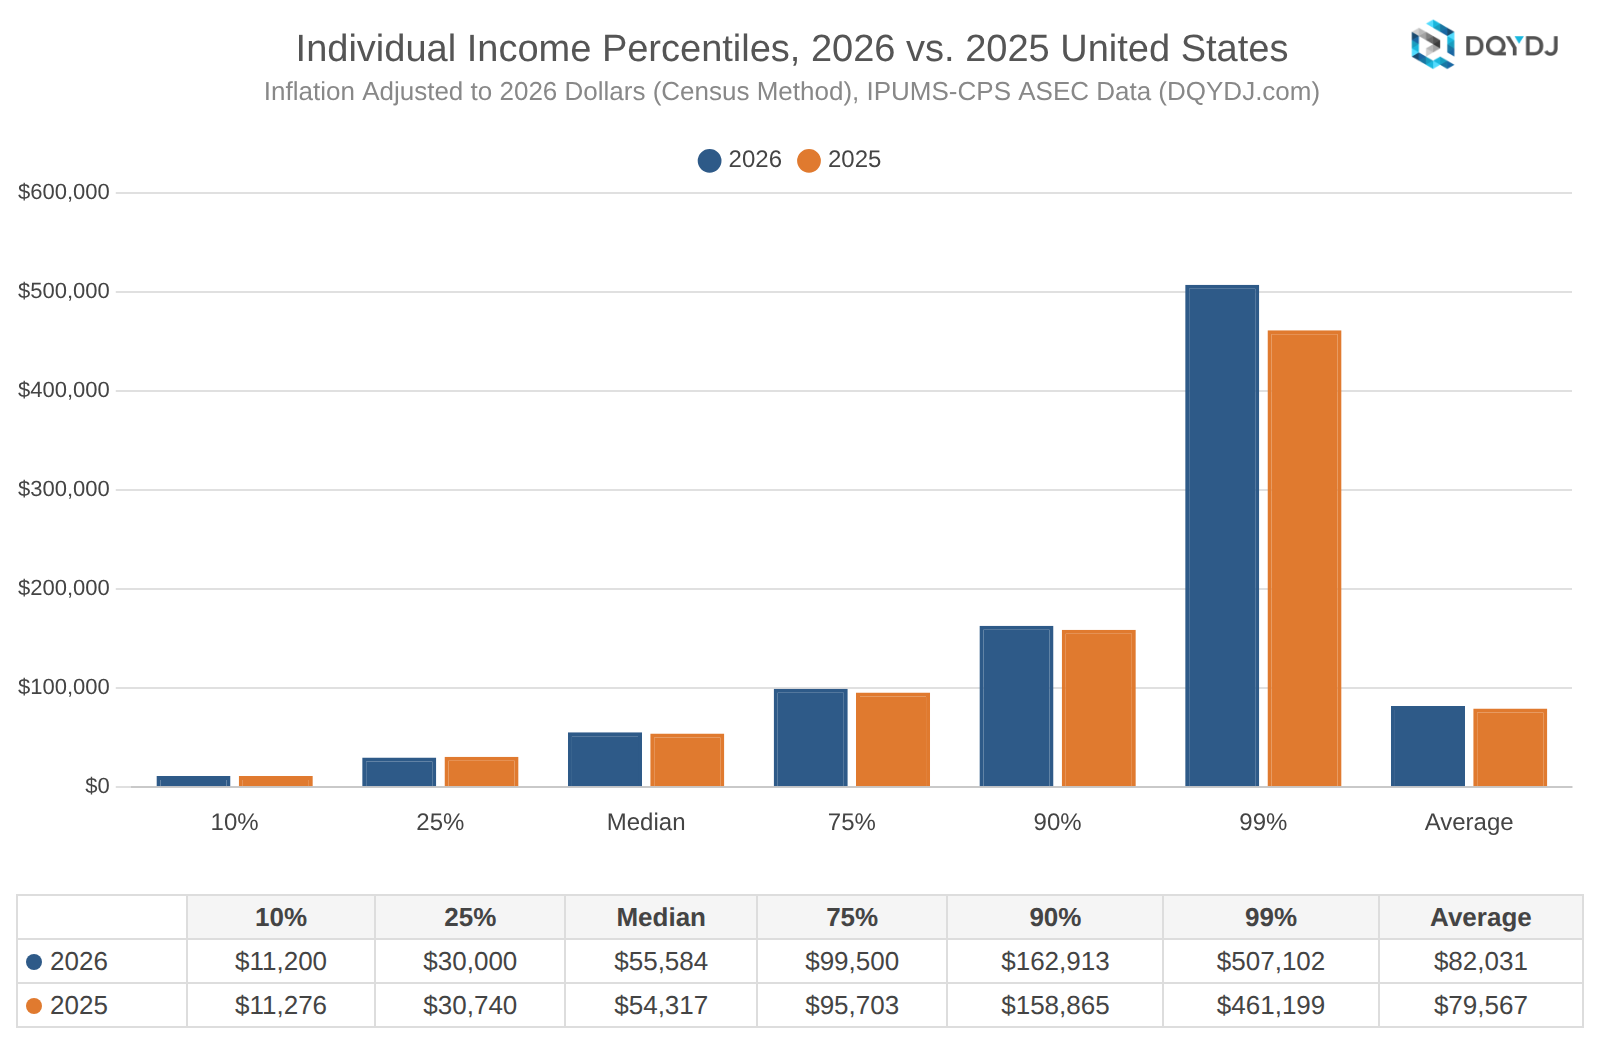
Selected United States individual income percentiles for 2026 and 2025
Individual income is defined as all income assigned to one individual. That is:
- Wage income (for more, see the dedicated salary research post)
- Business income
- Investment income (interest, dividends, and rent – but not capital gains)
- Other income (see the list)
Unlike the above section, this section is adjusted for inflation (using the Census Bureau's method). You can find the details here.
One thing to keep in mind: this data isn't longitudinal. The survey does not show you what a single individual earns year over year.
Individual income percentiles for the United States in 2026
The following table shows the change in every income percentile year over year. Inflation was 2.47% year over year, using the Census Bureau's method. So, if you see an increase of under 2.47% in a bracket, it represents a loss of earnings power – this year, 16 percentiles fell short, mostly at lower incomes, including every percentile from the 4th through 10th... though, see my warning in the next paragraph and FAQ!
As a warning, you can't compare the brackets directly. See the FAQ for more.
| Percentile | 2026 | 2025 | Change ($) | Change (%) |
| 1% | $0 | $0 | $0 | 0.00% |
| 2% | $0 | $0 | $0 | 0.00% |
| 3% | $180 | $170 | $10 | 5.88% |
| 4% | $1,501 | $1,500 | $1 | 0.07% |
| 5% | $3,001 | $3,000 | $1 | 0.03% |
| 6% | $4,701 | $4,800 | -$99 | -2.06% |
| 7% | $6,000 | $6,002 | -$2 | -0.03% |
| 8% | $8,000 | $8,000 | $0 | 0.00% |
| 9% | $10,000 | $10,000 | $0 | 0.00% |
| 10% | $11,200 | $11,005 | $195 | 1.77% |
| 11% | $13,000 | $12,500 | $500 | 4.00% |
| 12% | $15,000 | $14,309 | $691 | 4.83% |
| 13% | $15,750 | $15,002 | $748 | 4.99% |
| 14% | $17,810 | $17,000 | $810 | 4.76% |
| 15% | $19,600 | $18,200 | $1,400 | 7.69% |
| 16% | $20,000 | $20,000 | $0 | 0.00% |
| 17% | $21,000 | $20,035 | $965 | 4.82% |
| 18% | $22,500 | $21,932 | $568 | 2.59% |
| 19% | $24,001 | $23,000 | $1,001 | 4.35% |
| 20% | $25,000 | $24,054 | $946 | 3.93% |
| 21% | $25,600 | $25,000 | $600 | 2.40% |
| 22% | $27,002 | $26,000 | $1,002 | 3.85% |
| 23% | $28,452 | $27,001 | $1,451 | 5.37% |
| 24% | $30,000 | $28,253 | $1,747 | 6.18% |
| 25% | $30,000 | $30,000 | $0 | 0.00% |
| 26% | $30,400 | $30,000 | $400 | 1.33% |
| 27% | $32,000 | $30,112 | $1,888 | 6.27% |
| 28% | $33,370 | $31,816 | $1,554 | 4.88% |
| 29% | $35,000 | $32,627 | $2,373 | 7.27% |
| 30% | $35,010 | $34,001 | $1,009 | 2.97% |
| 31% | $36,003 | $35,000 | $1,003 | 2.87% |
| 32% | $37,800 | $35,250 | $2,550 | 7.23% |
| 33% | $39,000 | $36,400 | $2,600 | 7.14% |
| 34% | $40,000 | $38,000 | $2,000 | 5.26% |
| 35% | $40,003 | $39,000 | $1,003 | 2.57% |
| 36% | $41,000 | $40,000 | $1,000 | 2.50% |
| 37% | $42,012 | $40,002 | $2,010 | 5.02% |
| 38% | $44,000 | $40,804 | $3,196 | 7.83% |
| 39% | $45,000 | $42,000 | $3,000 | 7.14% |
| 40% | $45,320 | $43,345 | $1,975 | 4.56% |
| 41% | $47,000 | $45,000 | $2,000 | 4.44% |
| 42% | $48,005 | $45,050 | $2,955 | 6.56% |
| 43% | $50,000 | $46,110 | $3,890 | 8.44% |
| 44% | $50,000 | $48,000 | $2,000 | 4.17% |
| 45% | $50,036 | $49,000 | $1,036 | 2.11% |
| 46% | $51,001 | $50,000 | $1,001 | 2.00% |
| 47% | $52,070 | $50,002 | $2,068 | 4.14% |
| 48% | $53,728 | $50,600 | $3,128 | 6.18% |
| 49% | $55,000 | $52,000 | $3,000 | 5.77% |
| 50% | $55,584 | $53,010 | $2,574 | 4.86% |
| 51% | $57,083 | $54,834 | $2,249 | 4.10% |
| 52% | $59,000 | $55,310 | $3,690 | 6.67% |
| 53% | $60,000 | $57,000 | $3,000 | 5.26% |
| 54% | $60,100 | $59,000 | $1,100 | 1.86% |
| 55% | $61,410 | $60,000 | $1,410 | 2.35% |
| 56% | $63,005 | $60,020 | $2,985 | 4.97% |
| 57% | $65,000 | $61,001 | $3,999 | 6.56% |
| 58% | $65,629 | $62,511 | $3,118 | 4.99% |
| 59% | $67,601 | $64,793 | $2,808 | 4.33% |
| 60% | $70,000 | $65,351 | $4,649 | 7.11% |
| 61% | $70,219 | $67,350 | $2,869 | 4.26% |
| 62% | $72,005 | $69,900 | $2,105 | 3.01% |
| 63% | $74,283 | $70,101 | $4,182 | 5.97% |
| 64% | $75,200 | $72,000 | $3,200 | 4.44% |
| 65% | $77,004 | $74,000 | $3,004 | 4.06% |
| 66% | $79,409 | $75,013 | $4,396 | 5.86% |
| 67% | $80,131 | $76,275 | $3,856 | 5.06% |
| 68% | $82,001 | $78,665 | $3,336 | 4.24% |
| 69% | $84,772 | $80,005 | $4,767 | 5.96% |
| 70% | $86,045 | $81,361 | $4,684 | 5.76% |
| 71% | $89,071 | $84,000 | $5,071 | 6.04% |
| 72% | $90,527 | $85,700 | $4,827 | 5.63% |
| 73% | $93,051 | $89,000 | $4,051 | 4.55% |
| 74% | $96,000 | $90,500 | $5,500 | 6.08% |
| 75% | $99,500 | $93,400 | $6,100 | 6.53% |
| 76% | $100,100 | $96,239 | $3,861 | 4.01% |
| 77% | $102,002 | $100,000 | $2,002 | 2.00% |
| 78% | $105,000 | $100,430 | $4,570 | 4.55% |
| 79% | $108,503 | $103,056 | $5,447 | 5.29% |
| 80% | $111,401 | $106,500 | $4,901 | 4.60% |
| 81% | $115,530 | $110,101 | $5,429 | 4.93% |
| 82% | $120,001 | $114,260 | $5,741 | 5.02% |
| 83% | $123,000 | $119,125 | $3,875 | 3.25% |
| 84% | $127,501 | $121,527 | $5,974 | 4.92% |
| 85% | $132,351 | $126,001 | $6,350 | 5.04% |
| 86% | $139,350 | $130,750 | $8,600 | 6.58% |
| 87% | $145,006 | $137,101 | $7,905 | 5.77% |
| 88% | $150,100 | $144,001 | $6,099 | 4.24% |
| 89% | $155,030 | $150,130 | $4,900 | 3.26% |
| 90% | $162,913 | $155,042 | $7,871 | 5.08% |
| 91% | $172,000 | $162,795 | $9,205 | 5.65% |
| 92% | $181,231 | $172,724 | $8,507 | 4.93% |
| 93% | $196,004 | $183,102 | $12,902 | 7.05% |
| 94% | $206,750 | $200,000 | $6,750 | 3.38% |
| 95% | $225,901 | $210,351 | $15,550 | 7.39% |
| 96% | $250,600 | $236,400 | $14,200 | 6.01% |
| 97% | $288,098 | $264,701 | $23,397 | 8.84% |
| 98% | $351,503 | $316,098 | $35,405 | 11.20% |
| 99% | $507,102 | $450,100 | $57,002 | 12.66% |
Methodology on 2026 United States individual income brackets
Data is sourced from the United States Census Bureau's Annual ASEC survey, first released in September 2026. The University of Minnesota's Minnesota Population Center harmonizes it. Also, see the individual income by year post, for an example of how I use the harmonized data.
Sarah Flood, Miriam King, Renae Rodgers, Steven Ruggles, J. Robert Warren, Daniel Backman, Etienne Breton, Grace Cooper, Julia A. Rivera Drew, Stephanie Richards, David Van Riper, and Kari C.W. Williams. IPUMS CPS: Version 13.0 [dataset]. Minneapolis, MN: IPUMS, 2025. https://doi.org/10.18128/D030.V13.0
Over the years – thanks to feedback (and plenty of complaints!) from readers – I've improved the worker screen to include people in the workforce as well as people who want to find a job. Unlike with a monthly survey, we have to do some legwork because we want to see people who were in the workforce during all (or any) of 2025.
Here's how the screen works:
- At least age 16
- Worked at some point during the year
- Or report working 1 or more hours in a typical week now
- Or report 'want' or 'maybe want' a job
You can't compare them. The employment-population ratio is a snapshot of current working conditions taken monthly. This screen is attempting to show people who were in the workforce at some point in the year, so it will be biased higher.
Need an example? Consider a person who works a holiday job for one month in December. They would show up as "in the workforce" for my screen, though would not be in the workforce for a July monthly survey.
No, median and average income are not the same. They are both descriptions of the central tendency of a data set, but tell us different things:
- Median individual income means half of all individual workers made more, while half made less money in full-year 2025.
- Average individual income means we add up every worker's earnings in full-year 2025 then divide by the number of workers.
Median is the most important summary statistic for income data – it demarcates the point where half of workers make more money and half make less (ignoring the workers who make exactly the median, of course!).
These statistics contain more income types than the numbers from Social Security. The ASEC numbers are the gold standard estimates of income and poverty in the United States.
The Census Bureau creates the official poverty estimates for the United States. The numbers include all types of income (importantly: including investment income).
2026: 70,789 data-points representing an estimated 182,843,008 workers.
2025: 75,234 data-points representing an estimated 183,174,900 workers.
All income numbers in this post are gross income, or before tax.
This data is not longitudinal, which means it does not track the same individuals year over year.
It is a different set of people answering the survey than last year, people move in and out of the workforce, the workforce changes in size, and so on. There's no guarantee that a person is in exactly the same percentile two years in a row and each percentile bracket is a varying number of people depending on the year.
Analysis of individual income brackets in 2026
It's good fun putting these posts together (though tough!). Please check out the income percentile calculator, an interactive tool presenting these numbers in a more intuitive way. For year over year comparisons, use the individual income by year calculator or the income percentile growth comparison calculator.
See previous editions:
