
On this page are estimated United States Individual Income Brackets for 2020. You'll also find the average, median, and top 1% of individual incomes in the United States.
Individual incomes are limited to Americans who worked (or wanted to work) in 2019. Incomes are earned between January and December 2019.
Later, find our research on household incomes.
Individual Income Benchmarks in 2020
The most important summary statistics for income are:
- Median income
- Average income
- Top 1% income
Note these statistics are for all workers in the United States. To limit data to full time workers, compare incomes interactively in our individual income percentile calculator.
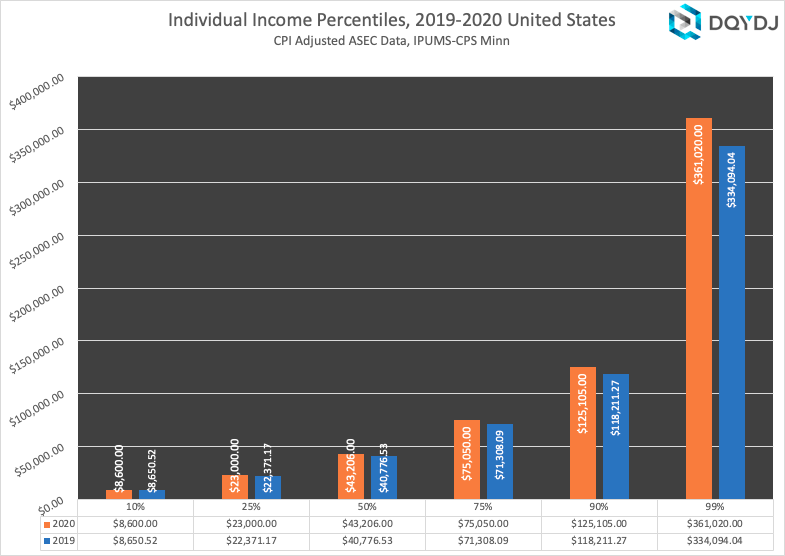
The comparison to 2019 data is nominal (except in the chart, which is adjusted with CPI).
What was the median individual income?
Median individual income in the United States was $43,206.00. It was up from $40,100.00 in 2019.
What was the average individual income?
Average individual income in 2020 in the United States was $62,518.13, up from $58,379.45 in 2019.
What is the top 1% individual income?
To be a top 1% earner in the United States in 2020, you had to make $361,020.00. It was up significantly from $328,551.00 in 2019.
Do you have individual income data by age?
Yes – see our average, median, and top 1% income by age research and the income percentile by age calculator.
Is median income the same as average income?
No, median and average income are not the same. They are both descriptions of the central tendency of a data set, but tell us different things:
- Median individual income means half of all individual workers made more, while half made less money in full-year 2019. See our median calculator for more.
- Average individual income means we add up every worker's earnings in full-year 2019 then divide by the number of workers. See our arithmetic mean calculator for more.
Median is the most important summary statistic for income data – it demarcates the point where half of workers make more money and half make less. By knowing the number of workers (~176.2 million in 2020) and the median, you have a decent feel for the data set.
Median is resistant to outliers while average isn't. It's possible to make billions of dollars a year – which can sway the average, but not the median for 175+ million workers. This is even worse with net worth, where a fair number of households have negative net worth yet the average is relatively large.
Selected United States Individual Income Percentiles for 2020 and 2019
Individual income is defined as all income earned assigned to one individual. Think:
- Wage income (see the dedicated salary research post)
- Business income
- Investment income
- Other income (see the list of everything)
Unlike the above section, this section is adjusted for inflation (CPI). You can find the details here, but in short: multiply 2019 data by (.663/.652);
On massive caution: this data isn't longitudinal. The survey does not show you how a single individual or household earns year over year. All it can show is the distribution (said another way: someone can be 1% in 2019, but not 2020).
As I often say, these numbers suggest for further research. However, they don't necessarily prove anything. Business intelligence, directionally correct, etc., and so on!
2020 Individual Income Percentiles for the United States
To recap, the summary statistics for individual earners:
- Top 1%: $361,020.00
- Median individual income: $43,206.00
- Average individual income: $62,518.13
Adjusted for inflation (CPI), top 1% and median were up 8.06% and 5.96%, respectively. Average individual income, CPI-adjusted, was up 5.31% in 2020.
| Individual Income Percentile | 2020 | 2019 | Absolute Increase | Percentage Change |
| 1.00% | $0.00 | $0.00 | $0.00 | 0.00% |
| 2.00% | $0.00 | $0.00 | $0.00 | 0.00% |
| 3.00% | $400.00 | $306.08 | $93.92 | 30.69% |
| 4.00% | $1,500.00 | $1,525.31 | ($25.31) | -1.66% |
| 5.00% | $2,500.00 | $2,542.18 | ($42.18) | -1.66% |
| 6.00% | $3,503.00 | $3,864.11 | ($361.11) | -9.35% |
| 7.00% | $5,000.00 | $5,084.36 | ($84.36) | -1.66% |
| 8.00% | $6,000.00 | $6,101.23 | ($101.23) | -1.66% |
| 9.00% | $7,250.00 | $7,426.21 | ($176.21) | -2.37% |
| 10.00% | $8,600.00 | $8,650.52 | ($50.52) | -0.58% |
| 11.00% | $10,000.00 | $10,168.71 | ($168.71) | -1.66% |
| 12.00% | $10,750.00 | $10,554.11 | $195.89 | 1.86% |
| 13.00% | $12,000.00 | $12,202.45 | ($202.45) | -1.66% |
| 14.00% | $13,000.00 | $12,690.55 | $309.45 | 2.44% |
| 15.00% | $14,005.00 | $14,236.20 | ($231.20) | -1.62% |
| 16.00% | $15,000.00 | $15,253.07 | ($253.07) | -1.66% |
| 17.00% | $16,000.00 | $15,303.91 | $696.09 | 4.55% |
| 18.00% | $17,000.00 | $16,426.54 | $573.46 | 3.49% |
| 19.00% | $18,000.00 | $17,804.40 | $195.60 | 1.10% |
| 20.00% | $19,002.00 | $18,324.02 | $677.98 | 3.70% |
| 21.00% | $20,000.00 | $19,426.31 | $573.69 | 2.95% |
| 22.00% | $20,002.00 | $20,337.42 | ($335.42) | -1.65% |
| 23.00% | $21,000.00 | $20,338.44 | $661.56 | 3.25% |
| 24.00% | $22,000.00 | $21,150.92 | $849.08 | 4.01% |
| 25.00% | $23,000.00 | $22,371.17 | $628.83 | 2.81% |
| 26.00% | $24,000.00 | $23,188.73 | $811.27 | 3.50% |
| 27.00% | $25,000.00 | $24,226.96 | $773.04 | 3.19% |
| 28.00% | $25,000.00 | $24,660.14 | $339.86 | 1.38% |
| 29.00% | $25,300.00 | $25,421.78 | ($121.78) | -0.48% |
| 30.00% | $26,101.00 | $25,427.88 | $673.12 | 2.65% |
| 31.00% | $27,205.00 | $26,438.65 | $766.35 | 2.90% |
| 32.00% | $28,009.00 | $27,455.52 | $553.48 | 2.02% |
| 33.00% | $29,250.00 | $28,472.39 | $777.61 | 2.73% |
| 34.00% | $30,000.00 | $29,082.52 | $917.48 | 3.15% |
| 35.00% | $30,001.00 | $30,506.13 | ($505.13) | -1.66% |
| 36.00% | $30,631.00 | $30,506.13 | $124.87 | 0.41% |
| 37.00% | $31,988.00 | $30,508.17 | $1,479.83 | 4.85% |
| 38.00% | $32,528.00 | $31,039.99 | $1,488.01 | 4.79% |
| 39.00% | $34,000.00 | $32,336.50 | $1,663.50 | 5.14% |
| 40.00% | $35,000.00 | $32,844.94 | $2,155.06 | 6.56% |
| 41.00% | $35,010.00 | $34,067.22 | $942.78 | 2.77% |
| 42.00% | $36,000.00 | $35,590.49 | $409.51 | 1.15% |
| 43.00% | $37,000.00 | $35,590.49 | $1,409.51 | 3.96% |
| 44.00% | $38,006.00 | $35,956.56 | $2,049.44 | 5.70% |
| 45.00% | $39,441.00 | $36,716.17 | $2,724.83 | 7.42% |
| 46.00% | $40,000.00 | $37,929.29 | $2,070.71 | 5.46% |
| 47.00% | $40,024.00 | $38,819.06 | $1,204.94 | 3.10% |
| 48.00% | $41,000.00 | $40,651.46 | $348.54 | 0.86% |
| 49.00% | $42,004.00 | $40,674.85 | $1,329.15 | 3.27% |
| 50.00% | $43,206.00 | $40,776.53 | $2,429.47 | 5.96% |
| 51.00% | $45,000.00 | $41,813.74 | $3,186.26 | 7.62% |
| 52.00% | $45,040.00 | $42,914.00 | $2,126.00 | 4.95% |
| 53.00% | $46,021.00 | $44,427.10 | $1,593.90 | 3.59% |
| 54.00% | $47,840.00 | $45,759.20 | $2,080.80 | 4.55% |
| 55.00% | $48,820.00 | $45,973.76 | $2,846.24 | 6.19% |
| 56.00% | $50,000.00 | $47,254.00 | $2,746.00 | 5.81% |
| 57.00% | $50,005.00 | $48,809.82 | $1,195.18 | 2.45% |
| 58.00% | $50,500.00 | $49,836.86 | $663.14 | 1.33% |
| 59.00% | $52,000.00 | $50,843.56 | $1,156.44 | 2.27% |
| 60.00% | $53,007.00 | $50,853.73 | $2,153.27 | 4.23% |
| 61.00% | $55,000.00 | $51,397.75 | $3,602.25 | 7.01% |
| 62.00% | $55,200.00 | $52,877.30 | $2,322.70 | 4.39% |
| 63.00% | $56,648.00 | $53,920.61 | $2,727.39 | 5.06% |
| 64.00% | $58,202.00 | $55,927.91 | $2,274.09 | 4.07% |
| 65.00% | $60,000.00 | $56,446.52 | $3,553.48 | 6.30% |
| 66.00% | $60,051.00 | $57,967.76 | $2,083.24 | 3.59% |
| 67.00% | $61,175.00 | $59,901.85 | $1,273.15 | 2.13% |
| 68.00% | $63,000.00 | $61,012.27 | $1,987.73 | 3.26% |
| 69.00% | $65,000.00 | $61,120.06 | $3,879.94 | 6.35% |
| 70.00% | $66,017.00 | $62,491.82 | $3,525.18 | 5.64% |
| 71.00% | $68,112.00 | $64,367.94 | $3,744.06 | 5.82% |
| 72.00% | $70,001.00 | $66,099.68 | $3,901.32 | 5.90% |
| 73.00% | $71,020.00 | $67,886.32 | $3,133.68 | 4.62% |
| 74.00% | $73,301.00 | $70,266.81 | $3,034.19 | 4.32% |
| 75.00% | $75,050.00 | $71,308.09 | $3,741.91 | 5.25% |
| 76.00% | $77,004.00 | $73,235.06 | $3,768.94 | 5.15% |
| 77.00% | $80,000.00 | $76,217.54 | $3,782.46 | 4.96% |
| 78.00% | $80,702.00 | $76,927.32 | $3,774.68 | 4.91% |
| 79.00% | $83,561.00 | $79,464.41 | $4,096.59 | 5.16% |
| 80.00% | $85,950.00 | $81,368.00 | $4,582.00 | 5.63% |
| 81.00% | $89,427.00 | $83,460.72 | $5,966.28 | 7.15% |
| 82.00% | $91,240.00 | $86,483.88 | $4,756.12 | 5.50% |
| 83.00% | $95,020.00 | $89,599.57 | $5,420.43 | 6.05% |
| 84.00% | $99,455.00 | $92,048.19 | $7,406.81 | 8.05% |
| 85.00% | $100,500.00 | $96,348.54 | $4,151.46 | 4.31% |
| 86.00% | $104,244.00 | $100,570.59 | $3,673.41 | 3.65% |
| 87.00% | $110,000.00 | $102,173.18 | $7,826.82 | 7.66% |
| 88.00% | $114,920.00 | $106,773.51 | $8,146.49 | 7.63% |
| 89.00% | $120,055.00 | $111,866.00 | $8,189.00 | 7.32% |
| 90.00% | $125,105.00 | $118,211.27 | $6,893.73 | 5.83% |
| 91.00% | $131,612.00 | $123,549.85 | $8,062.15 | 6.53% |
| 92.00% | $140,162.00 | $131,178.41 | $8,983.59 | 6.85% |
| 93.00% | $150,023.00 | $139,862.49 | $10,160.51 | 7.26% |
| 94.00% | $160,000.00 | $152,530.67 | $7,469.33 | 4.90% |
| 95.00% | $174,000.00 | $161,001.21 | $12,998.79 | 8.07% |
| 96.00% | $192,430.00 | $178,969.33 | $13,460.67 | 7.52% |
| 97.00% | $216,105.00 | $203,679.29 | $12,425.71 | 6.10% |
| 98.00% | $256,300.00 | $247,608.13 | $8,691.87 | 3.51% |
| 99.00% | $361,020.00 | $334,094.04 | $26,925.96 | 8.06% |
Methodology on 2020 United States Household Income Brackets
I source this data from the United States Census Bureau's Annual ASEC survey, released in September 2020. I use harmonized data from the University of Minnesota's Minnesota Population Center in R.
Sarah Flood, Miriam King, Renae Rodgers, Steven Ruggles and J. Robert Warren. Integrated Public Use Microdata Series, Current Population Survey: Version 7.0 [dataset]. Minneapolis, MN: IPUMS, 2020. https://doi.org/10.18128/D030.V7.0
What is your 'worker' screen?
To determine a "worker" we have to do a little legwork. Unlike with a monthly unemployment survey, we're trying to figure out people who are part of the workforce at some point in 2019.
Due to the (frankly, overwrought) complaints from our early efforts, we also include people who wanted a job in 2019 and didn't necessarily work. Here is the current screen:
- At least the age of 16
- Labeled as 'in workforce'
- Report working 1 or more hours in a typical week
- Report 'want' or 'maybe want' a job
How does annual income and your workforce determination compare to the employment population ratio?
In short: don't compare the two.
Remember: the employment population ratio is a point estimate. This article is based on annual income. It's possible a person was unemployed for a point (or even multiple points) in time over a year.
If you want specifics: my screen includes 67.58364% of the over 16 population in the United States.
Why don't these numbers match the Social Security Administration's earnings statistics?
This question also comes up every year, often as an attempt to dismiss these numbers. It's wrong. Let me be clear:
The ASEC numbers are the gold standard estimates of income and poverty in the United States.
Seriously. The ASEC is where the Census Bureau creates the official poverty estimates for the United States. The numbers include all types of income including investment income. They don't only include income where you would owe OASDI.
How many samples are in the 2020 and 2019 data?
- 2020: 82,990 data-points representing an estimated 176,214,306 workers.
- 2019: 93,939 data-points representing an estimated 174,279,931 American workers.
Is individual income gross or net?
All income numbers in this post are gross income, or before tax. The 2019 numbers are adjusted for CPI using the numbers in IPUMS's instructions.
Can you compare this individual income data year over year?
No, not exactly. This data is not longitudinal. It is a different set of people answering the survey than last year.
The numbers I'm summarizing do not necessarily prove anything about how individuals – or households – have performed year over year. They may give you an excellent pointer for where to start research, but please don't assume anything about individual income earners or brackets from this data – only where to draw the income lines.
Analysis of Individual Income Brackets in 2020
Individual income is certainly interesting, but in many ways household income is a better measure. Individual income is sensitive to our screen, while household income tends to show purchasing power – since a household can pool resources.
Still, individual income is about efficiency. It shows how much a single person can earn while working. Make sure you're looking at the proper series, and hope the data was useful!
See previous editions of the average, median, and top 1% individual income post:
