
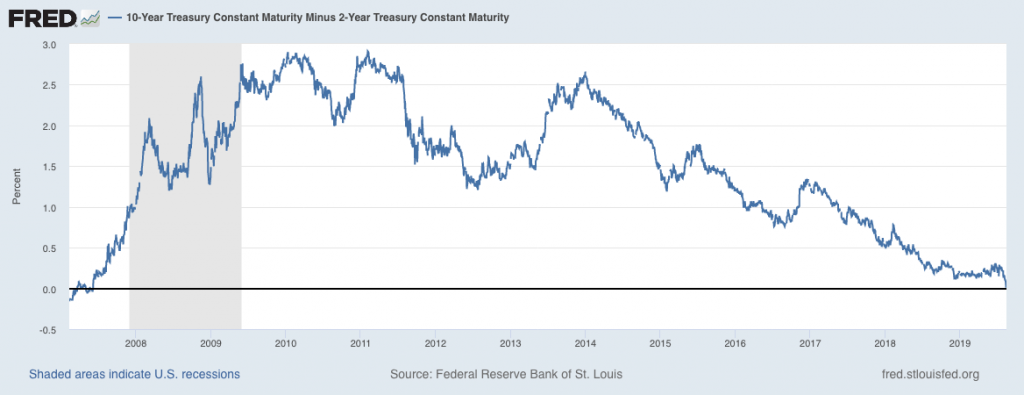
On 8/14/2019, briefly, 2 year Treasuries paid slightly better than 10 year Treasuries: 1.628% vs. 1.619%.
By day's end this brief inversion corrected, and the two yields settled at 1.58% and 1.59% respectively. Still, you can't un-ring that bell: regardless of the closing price, we witnessed the first 10 year - 2 year inversion since we "un-inverted" in June of 2017.
Of course, you're probably asking: what does the yield curve tell us? Why should the yield curve naturally slope upwards? And of course... what happens from here?
We'll do our best to answer, and link you some other recent posts. Let's party like it's 2007 and talk yield curves.
What is a Yield Curve?
A yield curve is a plot of any comparable form of debt with yield on the Y-Axis and time on the X-Axis. Most commonly, yield curve refers to the government yield curve in your home country.
If you don't hear modifiers assume the yield curve refers to government debt in the United States. However, know that "yield curve" isn't an exclusive term; if a company issued bonds with various time and yield to maturity you could talk about a company's yield curve.
Furthermore, yield curve is often shorthand for other measures. In the United States, when people talk about the yield curve offhand they usually mean the difference between the 10 year yield and either the 2 year yield or 3 month yield.
Why does the yield curve naturally slope upwards?
If people are perfectly neutral on the economy over the long term, then the yield curve will slope up and to the right. That is, as you increase the time to maturity on bonds and Treasuries the yield would be higher.
All else being equal, it's easier to predict the very near term future than further out.
Take the US yield curve: you probably have a better idea of the next three months than the next thirty years. Who knows what the economy and political climate will look like in thirty years?
If you demand a baseline amount plus a finger-in-the-air multiplier for uncertainty, uncertainty goes up as you move further out along the curve.
So, an inverted yield curve – or even a flattening yield curve(!) – means people are less bullish on the economy in the near term than further out. Their weight to economic performance is even beating the fuzziness of the future – not a great sign.
Inverted Yield Curves and Business Plans
We (the royal we) talk about the yield curve as a recession indicator. Truthfully, the yield curve might be even more than a harbinger; the slope of the curve itself affects some business models.
We talked above about company yields – let's discuss banks. Banks can borrow in the short term at or around the Federal Funds Rate. Long-term, they lend at a prevailing market rate - think mortgages, student loans, personal loans, business loans, and other long term debt.
Now, you and I can't borrow for 10 years at the same rate as the Treasury. However, if the premium between what citizens and businesses can borrow at market rates isn't high enough over the short term rate, what happens?
Well... then everything has to go perfectly for banks to make money. If any part of the model is wrong (say, more people default on mortgages than expected) banks will feel it.
And that's one mechanism for how the yield curve can both predict a recession... and accelerate one.
How does the Federal Reserve affect the yield curve?
The Federal Reserve primarily affects the shorter end of the yield curve. Since the Fed sets overnight lending rates to depository institutions (the Federal Funds Rate), '1 day' rates directly relate to the Fed's moves.
The Fed affects the longer end too through open market operations. The Fed can use proceeds from selling (or issuing) short-term Government Securities and buying longer dated Treasuries – for example, 10, 20, or 30 years out.
The Fed's buying pressure increases the price of the longer-dated debt. When Treasury prices increase, yields fall - and vice versa. The Fed has operationalized this multiple times, most recently in the so-called "QE2" program.
Through these mechanisms – and truthfully, the implications of having these mechanisms available – the Fed can affect the yield curve at any point.
Why Does the Yield Curve Tend to Invert Before a Recession? What Does the Yield Curve Tell Us?
All of the things we just discussed lead us to what does it mean?
Well, let's clear something up first. A yield curve doesn't mean that a recession is on our doorstep - note that the yield curve sometimes inverts and corrects without a recession (see: early 2006 then the quick rebound). Further, the yield curve didn't invert at all for an entire generation after the 1920s... and we still had recessions.
But linking to everything we said above, it's still a worrisome sign. But maybe "this time is different" (a phrase which means you should immediately be skeptical!).
One plausible scenario: the Federal Reserve might take the yield curve more seriously this time. In the below graph, you can see that since the 1990s the Fed has continued to raise rates – or keep them flat – even as the 10s2s yield curve flattened and inverted.
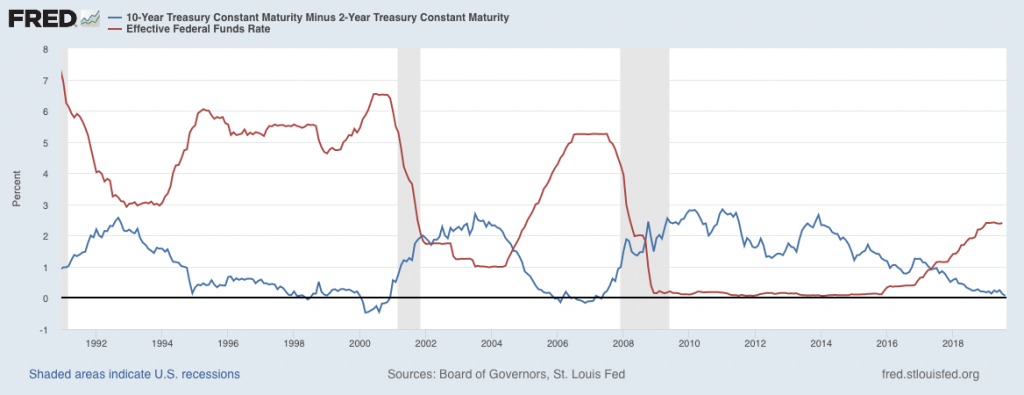
- Red: Effective Federal Funds Rate,
- Blue: 10 Year Treasury minus 2-Year Treasury (negative = inverted),
- Grey bar: Recession
Again, Fed mistake or not, an inversion is not a good sign:
- The normal shape of the yield curve with constant economic confidence is upwardly sloped
- An inverted yield curve most likely means lack of confidence in the short term versus the long term
- Some business models literally rely on an upward slope in the yield curve
At the end of the day, it's true: inverted yield curves often lead recessions.
Since the 1960s, a yield curve inversion in the 10 year - 3 month or 10 year - 2 year has preceded a recession by roughly 1-2 years. It doesn't really matter which of the two you pick, but watching the 3 month - 10 year is a little better than the widely watched 2 year - 10 year.
So, the briefly inverted 10s2s yields is a terrible sign. The continued inversion on other durations is also a bad sign. The longer the inversion continues, the harder it is to avoid a recession or other dip in economic output.
But optimistically, maybe this time really is different. Personally, though, I wouldn't count on it – I'm taking the indicator as real... but not panicking. How about you?
