
On this page you'll find John Bogle's Stock Valuation Model for the United States stock market.
It provides the historical Bogle Valuation Model stock return prediction using the S&P 500 as an input, with dividend yield, historical price/earnings ratio, and a least squares regression over the previous ten years' earnings feeding the model. Optionally, adjust the target P/E ratio to recompute for your prediction.
John Bogle's Valuation Model for the United States
What is Bogle's Valuation Model?
In 1991, John Bogle – the inventor of the index fund and founder of The Vanguard Group, Inc. – presented a model to estimate long-run stock returns in the United States in the Journal of Portfolio Management.
Bogle noted that you could (reasonably) predict stock market returns with three inputs:
- The initial dividend yield on the stock market
- An estimate of longer-run earnings growth
- The predicted change of Price/Earnings ratios
Okay – plenty of wiggle in those three inputs (for one, "are stock buybacks dividends?"). However, you can see what an incredible insight and simplification Bogle made.
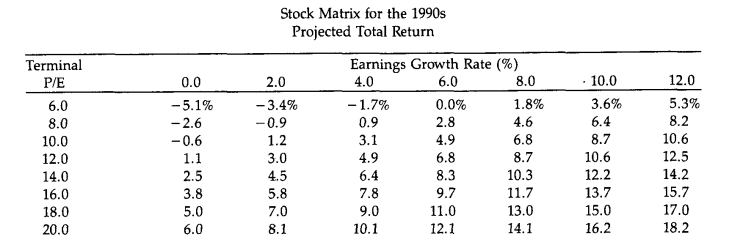
Suppose you can foresee dividend payouts and earnings. In that case, you're only at the mercy of the stock market's overall valuation – and Bogle computed returns for a range of terminal P/Es in his original article:
Bogle's Valuation Model Formula
The formula for Bogle's Valuation Model is:
R_t=D_0+G_t+ΔP/E
Where:
- R_t: Predicted 10-Year Return (expressed as an annual percentage)
- D_0: Initial dividend yield
- G_t: Predicted 10-year annual earnings growth
- ΔP/E_t: Annual change in P/E to bring it back to a terminal P/E
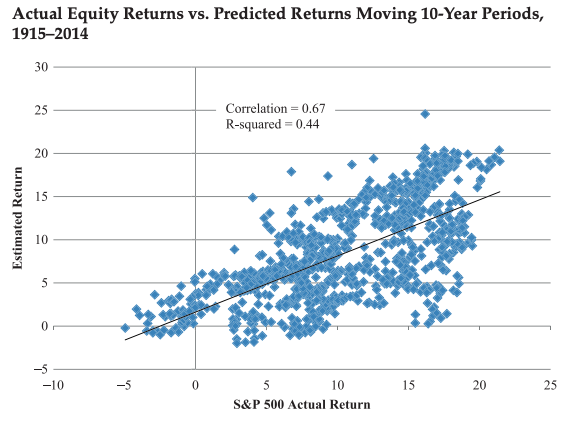
You can find the formula clearly stated in Bogle and Michael Nolan's 2015 paper, "Occam's Razor Redux" in The Journal of Portfolio Management. Here's how it performed using 10-year trailing earnings growth on the S&P 500 for a 100-year period:
Bogle's Valuation Model
The tool is relatively straightforward to use – you don't have to change anything if you don't choose, but if anything goes wrong, hit the "calculate" button again.
Here's what everything means:
Bogle Valuation Model Inputs
- Typical PE: What will the 'terminal' or final price/earnings ratio be in a decade? (By default, the tool uses the average in the dataset)
Bogle Valuation Model Outputs
- 10-Yr Ann. Stock Prediction (%): Bogle's model's prediction for stock market returns over the next ten years, using the assumptions (including your choice of terminal P/E)
- Current Trailing PE: Based on the last trailing 12-month earnings, what is the current price/earnings ratio on the S&P 500
- Average PE: Over the entire dataset – back to 1871 – what is the typical Price/Earnings ration on the S&P 500 with a (1-month resolution)
- Median PE: Over the dataset, what is the median price/earnings ratio
- Last Stock Price: The last month observation (see the S&P 500 tool for details)
Don't trust the numbers? You can export the raw data and apply your own transformation to the model. Hit the 'Download CSV with Data' button and the tool will export the inputs plus our computation for Bogle's prediction at each month.
Tool Methodology
I did have to make some judgement calls while making the tool. For starters, for the total US stock market, I use Professor Robert Shiller's S&P 500 historical data.
In general, read: these are assumptions built on assumptions.
Price/earnings and dividend yield inputs are straightforward from this data (although both are the last valid reading, not necessarily the leading month). I don't use today's earnings vs. ten-years ago – I use a least-squares regression (based on this function from Nic Mabon on Stack Overflow) and that slope/intercept to compute a less-noisy 10-year earnings growth... and project it forward.
By default, the tool uses the average P/E ratio to compute 'terminal' P/E for the prediction. You can change it, though – change 'Typical PE' to whatever you choose (the 2015 paper used 17.8) and calculate again.
Bogle's Stock Valuation Model
John Bogle was a true pioneer in the investing industry – there's a good argument changing minds (and via Vanguard) he's done more for the modern investor than anyone in history. I don't type that lightly.
But – is his model good?
In a sense, yes. He's decomposed returns to what are likely the core elements – how much stocks literally return in cash, plus their implied returns in earnings, plus a 'tide' measurement in price/earnings.
Of course, there are quibbles – are earnings more important than cash flows? What's a stock buyback? Is there really a k constant (spring constant for you non-Americans!) for price/earnings?
Still, his model is worth chewing on. Take it the same way you would the CAPE ratio, Tobin's Q, S&P 500 Price to Peak PE, S&P 500 Price to Sales Ratio, or Buffett Indicator – another input to your own predictions. Good luck with your investing!
Further Reading on the John Bogle Model
- Holman Jenkins's interview with John Bogle in the Wall Street Journal
- Meb Faber on the Model (who first turned me onto it)
