
A risk premium is the excess return an investor captures or anticipates between a risky asset and a comparable safer asset. A risk premium can either be a forward estimate (ex ante – what we expect) or a calculated result (ex post – what we observed).
In investing - and really, in participating in an economy - we're usually interested in the ex ante risk premium. Following are some measures of the current excess returns investors are demanding to take on risk. As you'll see in the graphs, large risk premiums occur when recession are looming (or concurrent).
These estimates were all pulled in or around mid-May 2018.
Investment Grade vs. Speculative Corporate Bond Risk Premium
Currently, the delta between CCC and AAA Corporate debt is approximately 6.2% as estimated by ICE BofAML indices.
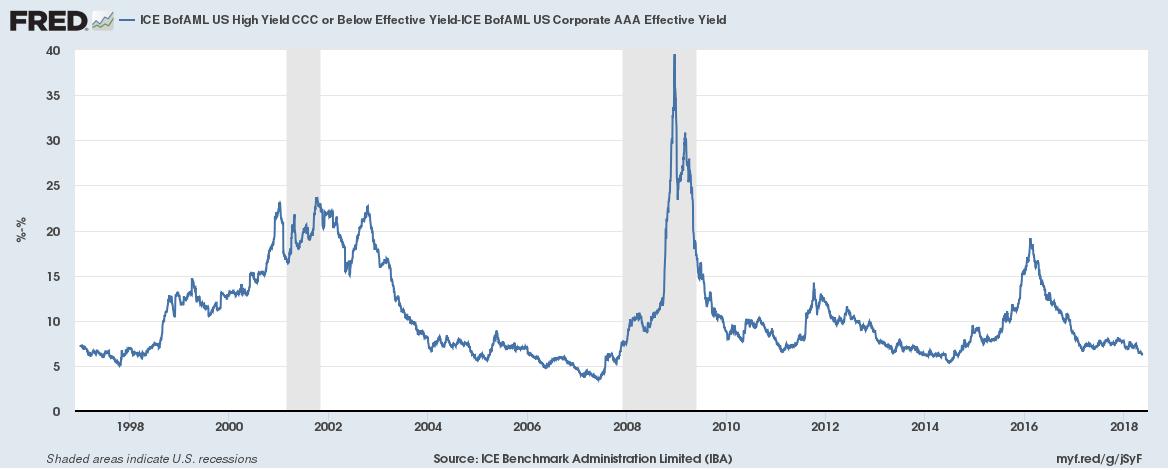
This common measure of a risk premium comes from the spread between types of corporate debt. To find these, Bank of America via Intercontinental Exchange publishes a number of estimates of yield on corporate debts (you can find them on FRED).
AAA is the highest safety rating on a longer-term corporate bond, as determined by Moody's, Fitch, or S&P. CCC is the lowest rating from Fitch or S&P not expected to immediately threaten default. Taking the spread between the two shows how much more investors are demanding to take on the speculative debt versus the safe corporate debt.
The spike in November 2008? Investors were demanding a whopping 32.4% percentage point premium to take CCC debt over AAA debt. Prior to the Great Recession, the spread stood at 3.59% in May 2007 and increased to 7.75% in December 2007.
Interested in how each has performed? We have corporate debt total return calculators here on the site:
- Investment grade corporate debt (AAA, AA, A)
- Medium grade corporate debt (BBB, BB, B)
- Speculative grade corporate debt (CCC and below)
7-10 Year Investment Grade vs. 10 Year Treasury Risk Premium
Currently, the spread between AAA Corporate debt as rated by Moody's and 10-year treasuries is .97%.
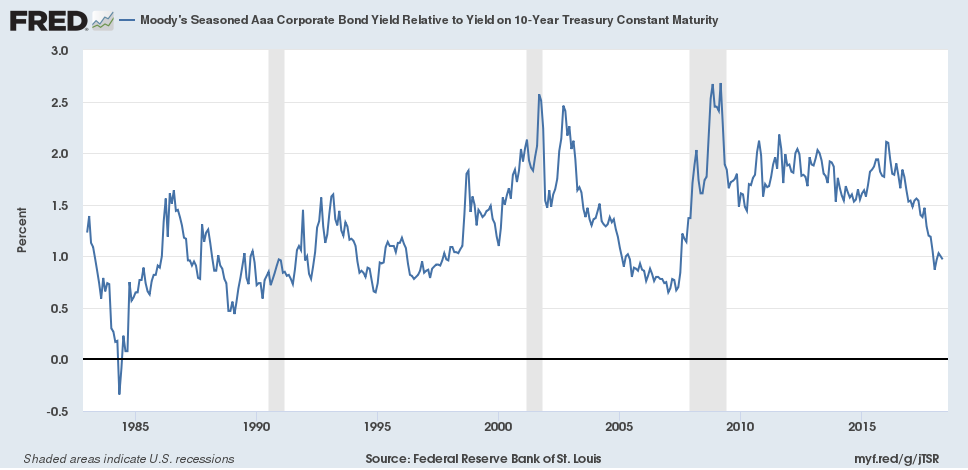
Although AAA corporate debt is generally considered very safe, it can't match the safety of US Debt.
The US has never defaulted on a debt (although a strange corner case happened in 1979) and has the power to tax, garnish, arrest, imprison, inflate, and use other methods of diplomacy, finance, and force to raise funds. Even the largest corporations no longer have standing armies – it's safe to say that US government debt is in a class of its own for safety.
Before the Great Recession, this measurement bottomed at .65% in January 2007. In December 2007 it was sitting at 1.35%. During the recession, it went all the way up to 2.68% in March 2009.
And no, your eyes don't deceive you - there was a period in 1984 where 10 Year treasuries paid more than AAA corporates! In May 1984 the spread stood at -.34%.
Peer-to-Peer Lending Safe vs. Risky Premium
As of late March, the spread between yields demanded on risky (E) 36-month loans versus safe (A) loans on the Lending Club platform was approximately 17.67% on March 23, 2018.
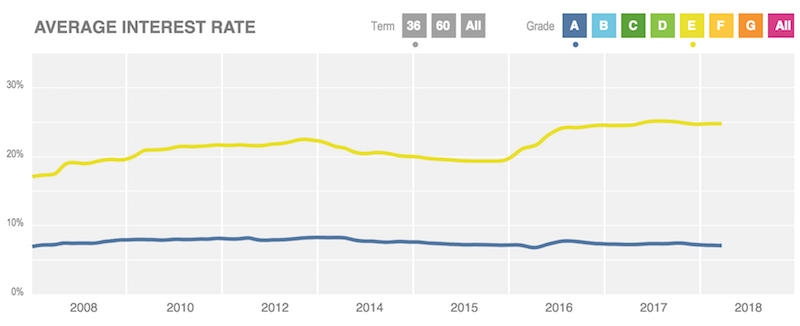
Long-time reader Clint had the clever idea to look at the spread between risky and safe peer-to-peer loans. We used Lending Club's summary data with 'E' and 'A' rated loans ('E' was the riskiest loan rating on the platform as of November 2017) and WebPlotDigitizer to see the spread trend all-time.
As you can see visually, the spread has been in or around 17% and change for quite some time. The spread started raising after late November 2015 after bouncing between 12.10% and 12.20% for 4 months.
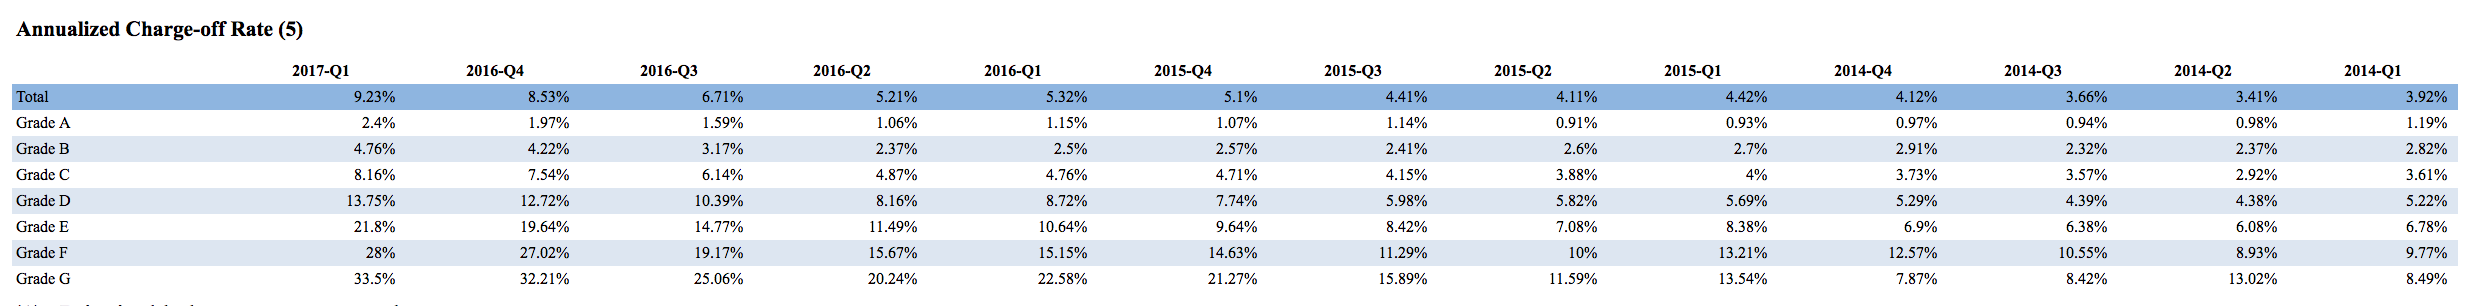
For a 'safety' reference, here are the historical charge-off rates on Lending Club loans by risk class as reported in their last prospectus:
What Are Risk Premia Telling Us?
There are many more risk premia than the three we've shown here (dare we say an infinite number?). Depending on your interest you can compare all manner of asset classes across time, type, and geography - just make sure you control for other variables such as duration.
This exercise has shown us that this particular cross-section of risk premiums has been relatively stable in the recent past. Instead of spiky spreads, we're seeing controlled dips and raises. In the case of corporate and US government debt, we're seeing 10 year treasuries become cheaper relative to AAA corporates. To our eye, there's nothing curious happening yet – by these series the economy looks strong.
We'll try come back to this in a few months and see if there are any changes. Let us know if you see any interesting relationships in the selected.
